Daniocell
ksr1a (blastomeres)
kinase suppressor of ras 1a
ZFIN
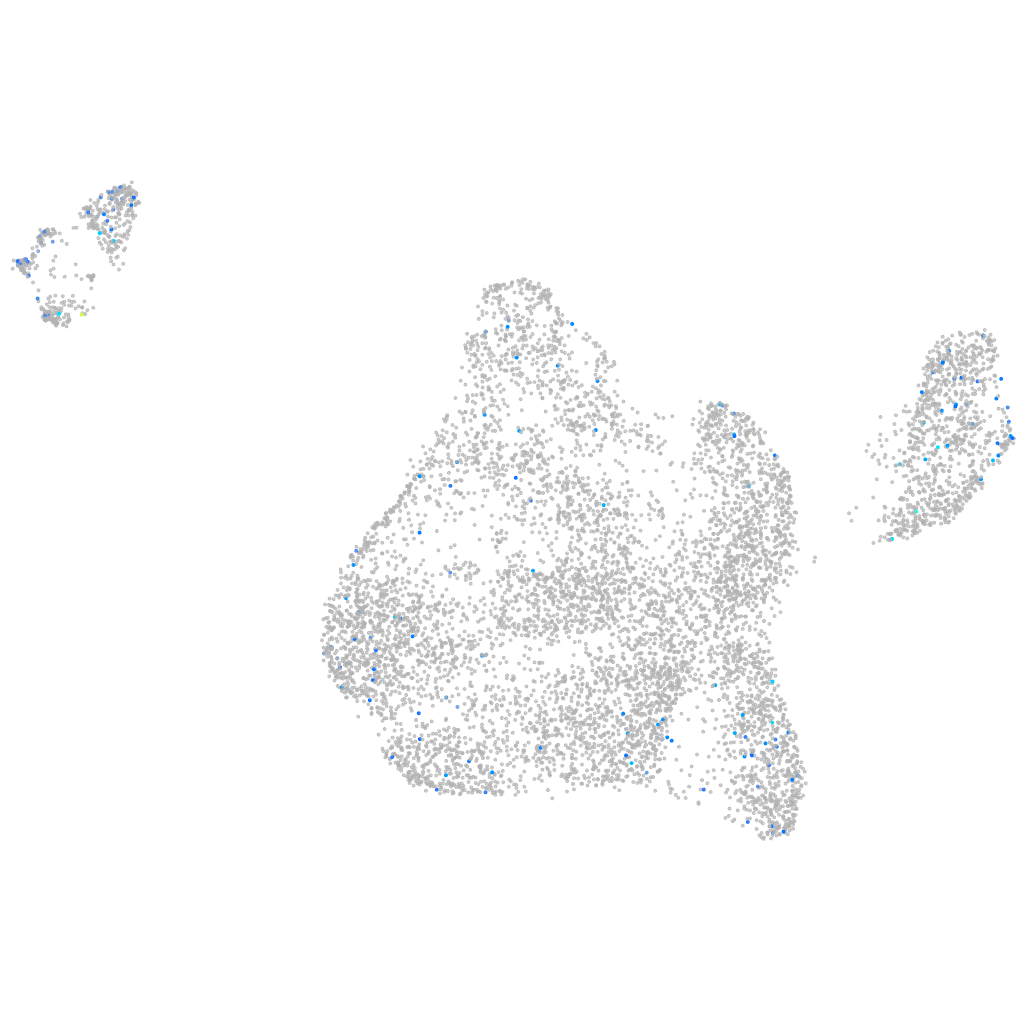
Gene expression UMAP
Display:
Expression
Stage
Other cell groups
all cells
blastomeres
PGCs
endoderm
axial mesoderm
muscle
mural cells /
non-skeletal muscle
mesenchyme
hematopoietic /
vasculature
pronephros
neural
spinal cord / glia
eye
taste / olfactory
otic / lateral line
epidermis
periderm
fin
ionocytes / mucous
pigment cells
Expression by stage/cluster
Correlated gene expression
Positive correlation
Negative correlation
Gene
r
Gene
r
si:dkeyp-72e1.7
0.157
stm
-0.077
si:dkey-19a16.12
0.142
si:ch211-222l21.1
-0.077
mmp16b
0.127
hmgb2a
-0.075
igsf5b
0.123
hspb1
-0.074
lama5
0.117
si:ch211-152c2.3
-0.073
pdzrn3a
0.109
eef1a1l1
-0.073
si:ch73-144l3.1
0.109
aldob
-0.067
LOC108183927
0.106
rplp1
-0.065
bsna
0.104
marcksl1b
-0.064
LOC110438093
0.104
dynll1
-0.064
SLC35D3
0.104
hnrnpa0b
-0.061
si:ch73-15b2.5
0.101
si:dkey-151g10.6
-0.060
gfi1b
0.101
polr3gla
-0.059
si:ch211-284e20.8
0.100
ybx1
-0.059
LOC101885283
0.096
si:ch73-1a9.3
-0.058
CT573392.1
0.095
rplp0
-0.055
si:dkey-58j15.10
0.095
hmgn6
-0.055
dre-let-7g-1
0.094
npm1a
-0.054
col2a1b
0.089
hmga1a
-0.054
mvb12bb
0.088
rps24
-0.053
LOC101882453
0.088
ncl
-0.052
myo1ea
0.086
ptmab
-0.052
CU459093.1
0.084
rpl15
-0.051
si:ch211-191a24.4
0.084
rps15a
-0.050
ncam3
0.083
rpl35a
-0.049
cldnd
0.083
rps13
-0.049
btg4
0.083
rps16
-0.048
wee2
0.082
tuba8l4
-0.048
LOC108182890
0.082
rps19
-0.048
LOC103911458
0.082
rpl27
-0.048
ccna1
0.081
rps5
-0.047
map1lc3c
0.081
mcm3
-0.046
si:ch211-250m6.7
0.081
rps6
-0.046
fbxl3l
0.081
rplp2l
-0.045
ftr56
0.080
rps29
-0.045