Daniocell
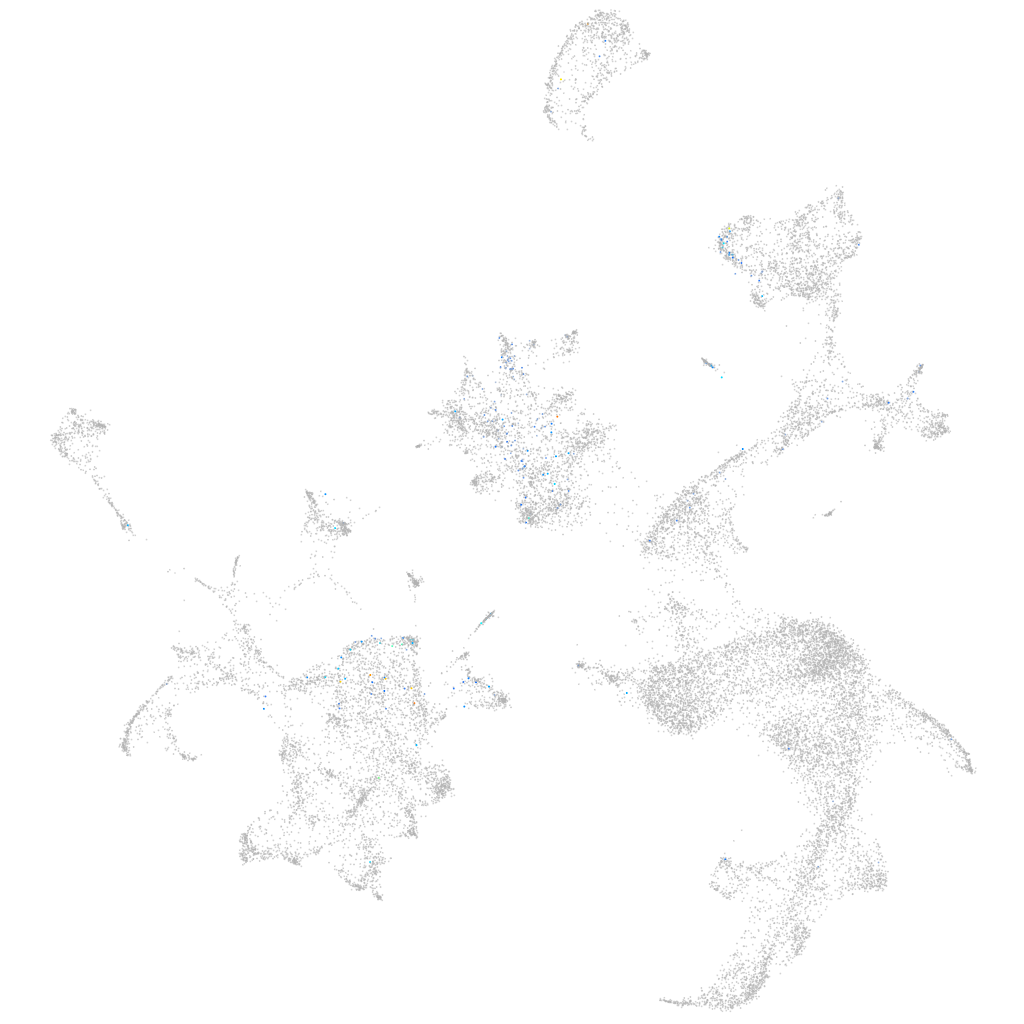
ksr1a (hematopoietic / vasculature)
kinase suppressor of ras 1a
ZFIN
Gene expression UMAP
Display:
Expression
Stage
Other cell groups
all cells
blastomeres
PGCs
endoderm
axial mesoderm
muscle
mural cells /
non-skeletal muscle
mesenchyme
hematopoietic /
vasculature
pronephros
neural
spinal cord / glia
eye
taste / olfactory
otic / lateral line
epidermis
periderm
fin
ionocytes / mucous
pigment cells
Expression by stage/cluster
Correlated gene expression
Positive correlation
Negative correlation
Gene
r
Gene
r
si:ch1073-391i24.1
0.222
alas2
-0.038
si:dkey-47k20.2
0.176
epb41b
-0.038
si:dkeyp-93h6.1
0.155
slc4a1a
-0.037
si:dkeyp-82b4.2
0.152
zgc:163057
-0.036
XLOC-028023
0.140
tspo
-0.035
mapkapk2b
0.120
nt5c2l1
-0.035
LOC110437966
0.118
hemgn
-0.034
LOC101886427
0.114
cahz
-0.034
XLOC-003136
0.109
zgc:56095
-0.034
BX569779.1
0.103
blvrb
-0.033
LOC101887092
0.098
fth1a
-0.033
birc5b
0.096
nmt1b
-0.033
stab1
0.095
hbbe1.2
-0.031
or102-3
0.093
hbbe2
-0.031
pdzrn3a
0.091
hbbe3
-0.030
LOC110438242
0.088
hbae1.3
-0.030
si:ch211-191j22.8
0.085
hbae1.1
-0.030
si:dkey-85k7.11
0.083
sptb
-0.029
LOC110438309
0.083
uros
-0.028
CR974475.1
0.083
tfr1a
-0.028
BX323830.1
0.082
tmod4
-0.028
olfcd2
0.082
hbbe1.3
-0.027
dnah11
0.082
fam53b
-0.027
lgmn
0.082
znfl2a
-0.027
mfsd11
0.080
prdx2
-0.027
cltca
0.078
hbae3
-0.027
g0s2
0.078
gata1a
-0.027
gdpd5b
0.078
si:ch211-207c6.2
-0.027
BX072576.1
0.077
hbbe1.1
-0.027
gna15.4
0.077
hdr
-0.027
acot7
0.076
urod
-0.026
XLOC-038699
0.076
rfesd
-0.026
glula
0.076
aqp1a.1
-0.026
si:ch211-214p13.9
0.075
si:ch211-250g4.3
-0.026
CR450686.5
0.075
plac8l1
-0.025