Daniocell
itih5 (blastomeres)
inter-alpha-trypsin inhibitor heavy chain 5
ZFIN
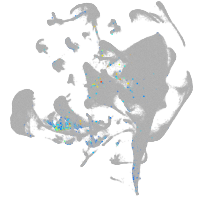
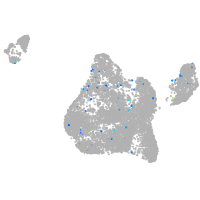
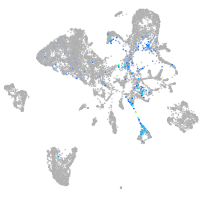
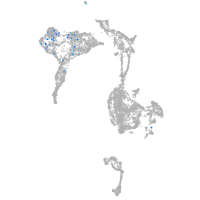
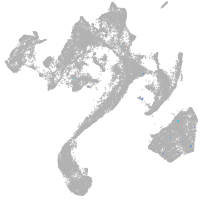
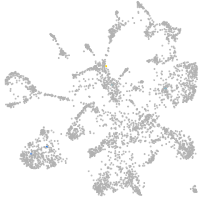
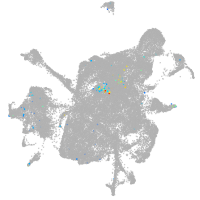
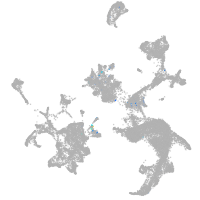
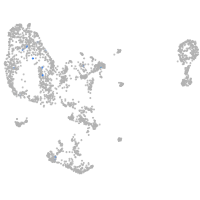
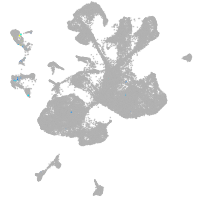
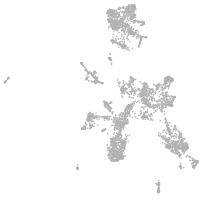
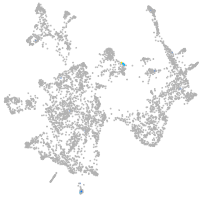
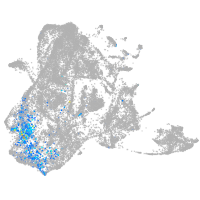
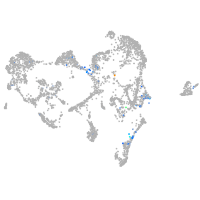
Gene expression UMAP
Display:
Expression
Stage
Other cell groups
all cells
blastomeres
PGCs
endoderm
axial mesoderm
muscle
mural cells /
non-skeletal muscle
mesenchyme
hematopoietic /
vasculature
pronephros
neural
spinal cord / glia
eye
taste / olfactory
otic / lateral line
epidermis
periderm
fin
ionocytes / mucous
pigment cells
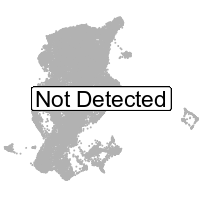
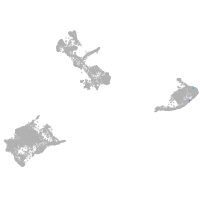
Expression by stage/cluster
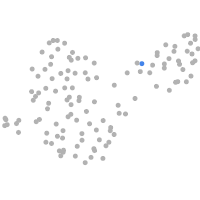
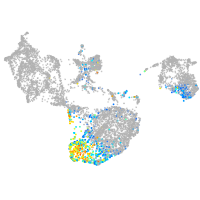
Correlated gene expression
Positive correlation
Negative correlation
Gene
r
Gene
r
LOC100332070
0.158
ppp3r1a
-0.034
LOC101885394
0.151
sox3
-0.032
gdap1l1
0.135
sult6b1
-0.031
rprml
0.126
zyx
-0.031
MYO1G
0.122
LOC110438541
-0.030
cd81b
0.121
ube2nb
-0.030
BX004857.1
0.119
dhx9
-0.029
FO704607.1
0.116
wu:fj13e08
-0.028
LOC101883154
0.110
h3f3d
-0.028
rhot1b
0.109
XLOC-015432
-0.028
LOC101884237
0.109
ctps1a
-0.028
XLOC-038902
0.108
hmga1a
-0.027
colgalt2
0.102
alcamb
-0.027
BX649559.1
0.098
tead3b
-0.027
LOC110439898
0.096
ipo7
-0.027
pcdh2ab2
0.095
itm2ba
-0.027
LOC101886825
0.095
snx30
-0.027
LOC100332761
0.093
rrp9
-0.026
nek3
0.093
wdr62
-0.026
LOC110438228
0.092
otx1
-0.026
pcdh1gc5
0.092
prmt6
-0.026
BX649300.3
0.091
pelp1
-0.026
kcnq5b
0.090
crabp2b
-0.026
camk2n2
0.089
sf3b2
-0.026
LOC108183290
0.088
ctbp1
-0.026
LOC101886933
0.088
cenpk
-0.025
zmp:0000000608
0.087
tsc22d2
-0.025
si:ch211-117n7.6
0.084
rpf2
-0.025
ponzr2
0.082
trim71
-0.025
si:dkey-28i19.1
0.081
arfgap2
-0.025
si:dkey-12h9.6
0.080
ube2ib
-0.025
fat1b
0.080
cox6a1
-0.025
CABZ01056843.1
0.079
midn
-0.025
cthrc1a
0.078
fhdc3
-0.025
mocs1
0.078
pfkfb4b
-0.024