Daniocell
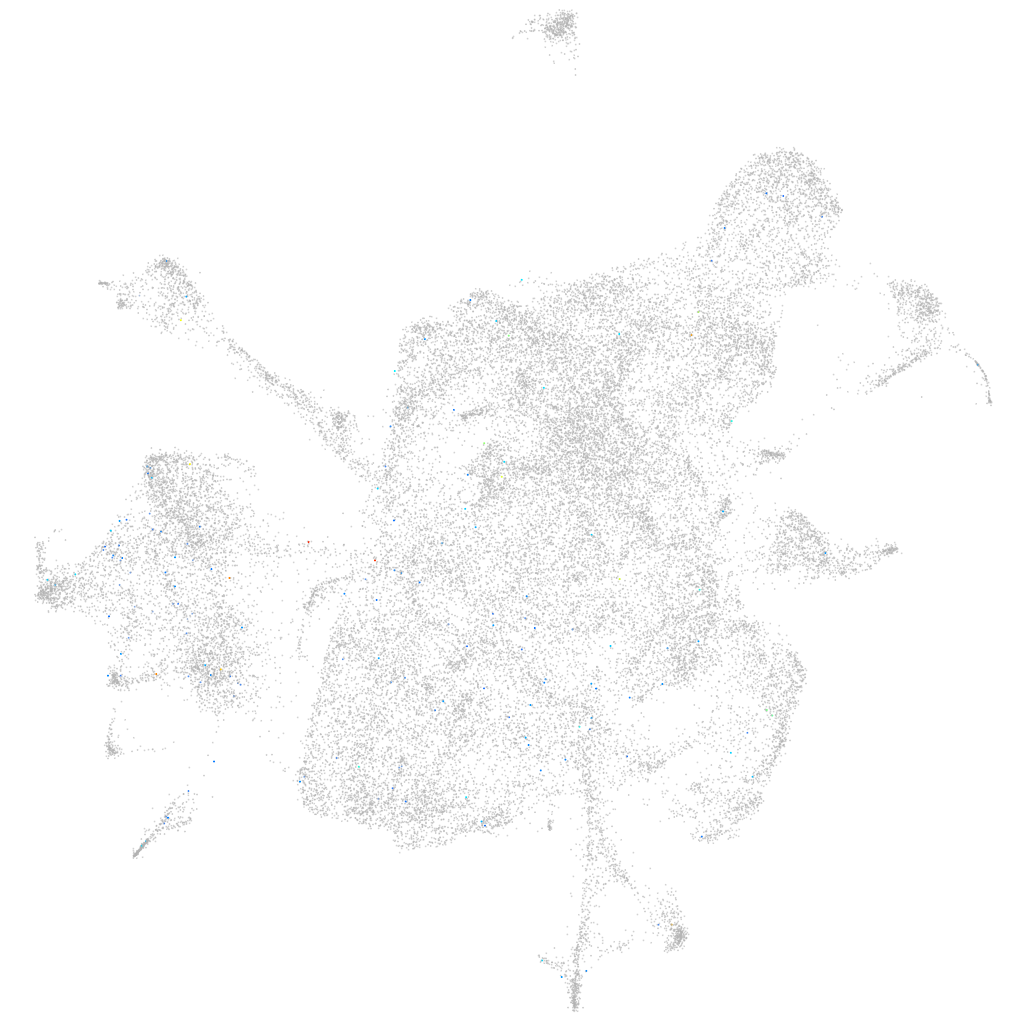
il12bb (mesenchyme)
"interleukin 12B, b"
ZFIN
Gene expression UMAP
Display:
Expression
Stage
Other cell groups
all cells
blastomeres
PGCs
endoderm
axial mesoderm
muscle
mural cells /
non-skeletal muscle
mesenchyme
hematopoietic /
vasculature
pronephros
neural
spinal cord / glia
eye
taste / olfactory
otic / lateral line
epidermis
periderm
fin
ionocytes / mucous
pigment cells
Expression by stage/cluster
Correlated gene expression
Positive correlation
Negative correlation
Gene
r
Gene
r
XLOC-040787
0.235
rpl34
-0.019
ccdc170
0.129
foxc1b
-0.017
gmnc
0.110
zgc:162730
-0.016
si:dkey-238k10.3
0.103
rpl27a
-0.015
XLOC-040495
0.102
sparc
-0.015
BX547934.1
0.094
emid1
-0.015
hspb3
0.087
wu:fb55g09
-0.015
LOC100332582
0.083
sfrp2
-0.014
tmtopsa
0.083
socs3a
-0.014
LOC110440218
0.077
zgc:153675
-0.014
nmur3
0.073
gsc
-0.014
LOC110438203
0.070
col9a3
-0.014
CR382337.2
0.068
fgfbp2b
-0.013
LOC110439198
0.066
col2a1b
-0.013
LOC100007813
0.063
rpl31
-0.013
tp73
0.062
thbs1b
-0.013
znf1021
0.061
fosb
-0.013
LOC110437744
0.061
cyt1
-0.013
CU682811.2
0.060
cebpd
-0.012
LOC110439386
0.060
hvcn1
-0.012
arhgap22
0.058
rps23
-0.012
CABZ01012885.1
0.058
tnni2a.4
-0.012
FQ377991.1
0.057
igf2b
-0.012
LOC108191349
0.055
STMP1
-0.012
LOC110438342
0.055
col1a2
-0.012
BX927282.3
0.054
arl6ip5b
-0.012
asmt
0.052
myhz1.1
-0.012
CT573793.2
0.052
rps16
-0.012
etv1
0.051
col11a1b
-0.012
LOC108190486
0.051
ecrg4a
-0.012
LOC101884250
0.051
rpl26
-0.012
pls1
0.051
col11a2
-0.012
zgc:113425
0.051
mir199-3
-0.012
XLOC-036274
0.050
MDFI
-0.011
LOC101882928
0.049
nupr1a
-0.011