Daniocell
il12bb (fin)
"interleukin 12B, b"
ZFIN
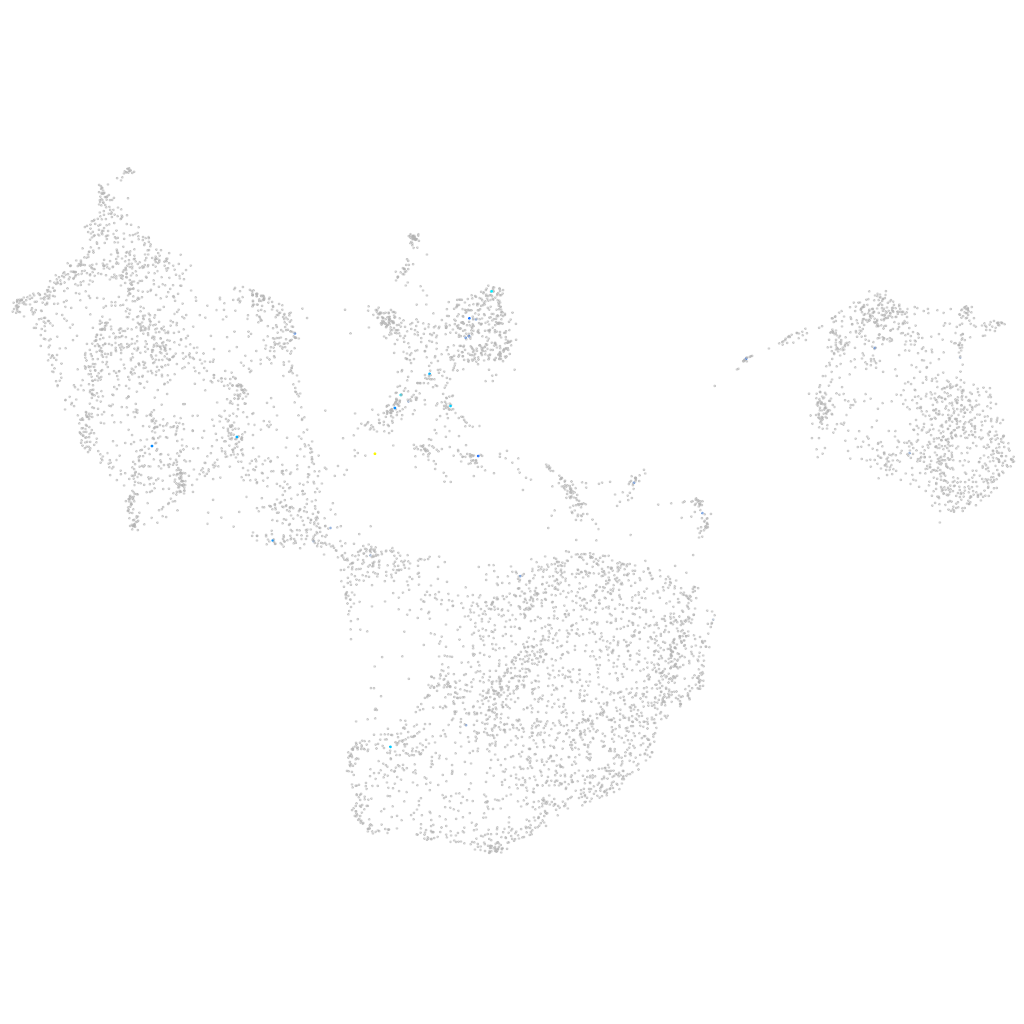
Gene expression UMAP
Display:
Expression
Stage
Other cell groups
all cells
blastomeres
PGCs
endoderm
axial mesoderm
muscle
mural cells /
non-skeletal muscle
mesenchyme
hematopoietic /
vasculature
pronephros
neural
spinal cord / glia
eye
taste / olfactory
otic / lateral line
epidermis
periderm
fin
ionocytes / mucous
pigment cells
Expression by stage/cluster
Correlated gene expression
Positive correlation
Negative correlation
Gene
r
Gene
r
mxg
0.333
sparc
-0.042
foxb2
0.312
thy1
-0.034
sntg1
0.301
zgc:92744
-0.033
zp3a.1
0.290
and1
-0.031
LOC101882460
0.287
fosb
-0.030
CABZ01058723.1
0.286
ctsla
-0.030
vwa5b2
0.285
ubb
-0.029
LOC101885907
0.277
waslb
-0.028
LOC110437924.1
0.271
btg2
-0.028
grid2
0.243
si:ch211-264f5.6
-0.028
AL772314.1
0.239
col1a1a
-0.028
RF00334
0.224
gpa33a
-0.028
LOC100149554.1
0.219
dusp6
-0.027
LRRC56
0.213
ccdc28a
-0.026
pfkfb2b
0.207
brd4
-0.026
LOC100534993
0.206
arpc1b
-0.026
CABZ01079853.1
0.200
GCA
-0.025
si:ch211-269k10.5
0.199
selenow1
-0.025
CU929451.1
0.198
abracl
-0.025
si:rp71-1h3.1
0.198
gsta.1
-0.025
tmem121aa
0.190
s100v2
-0.025
si:ch73-144d13.7
0.189
capn12
-0.025
si:ch211-145o7.3
0.187
frem2b
-0.025
pglyrp2
0.185
thbs4b
-0.025
dclk2b
0.181
si:dkey-102c8.3
-0.025
npy8br
0.180
ppp1r9alb
-0.024
btr23
0.179
capn2a
-0.024
pcyt1ba
0.178
limd2
-0.024
LOC108179656
0.177
mgst3a
-0.024
XLOC-021400
0.175
tmem238a
-0.024
tbc1d16
0.175
cnn2
-0.024
si:ch73-362m14.4
0.172
eef1da
-0.024
poln
0.169
si:dkey-19b23.12
-0.024
LOC101882344
0.168
klf3
-0.024
nsmfa
0.167
vaspb
-0.024