Daniocell
hlx1 (otic / lateral line)
H2.0-like homeo box 1 (Drosophila)
ZFIN
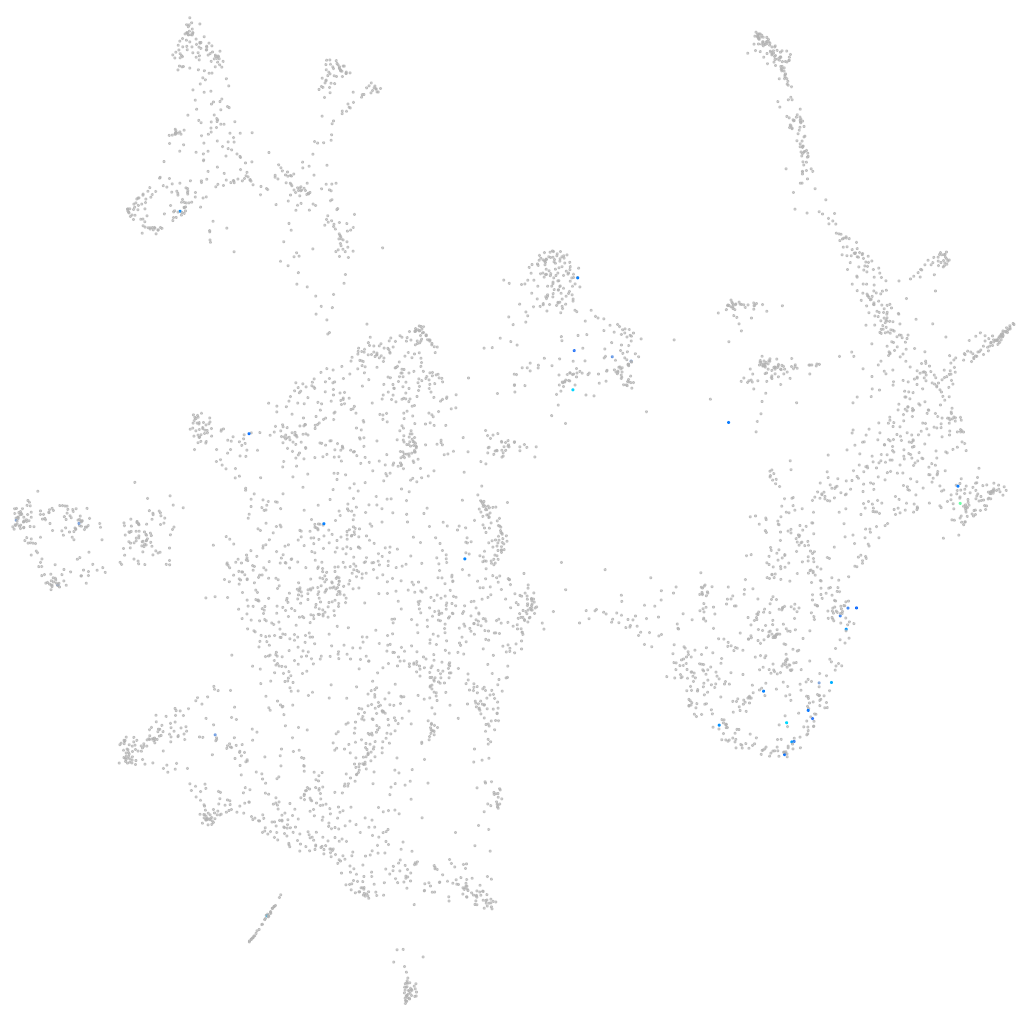
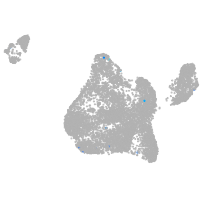
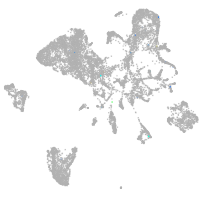
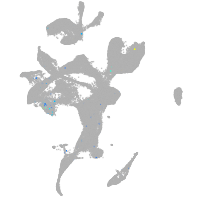
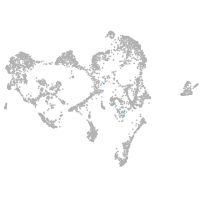
Gene expression UMAP
Display:
Expression
Stage
Other cell groups
all cells
blastomeres
PGCs
endoderm
axial mesoderm
muscle
mural cells /
non-skeletal muscle
mesenchyme
hematopoietic /
vasculature
pronephros
neural
spinal cord / glia
eye
taste / olfactory
otic / lateral line
epidermis
periderm
fin
ionocytes / mucous
pigment cells
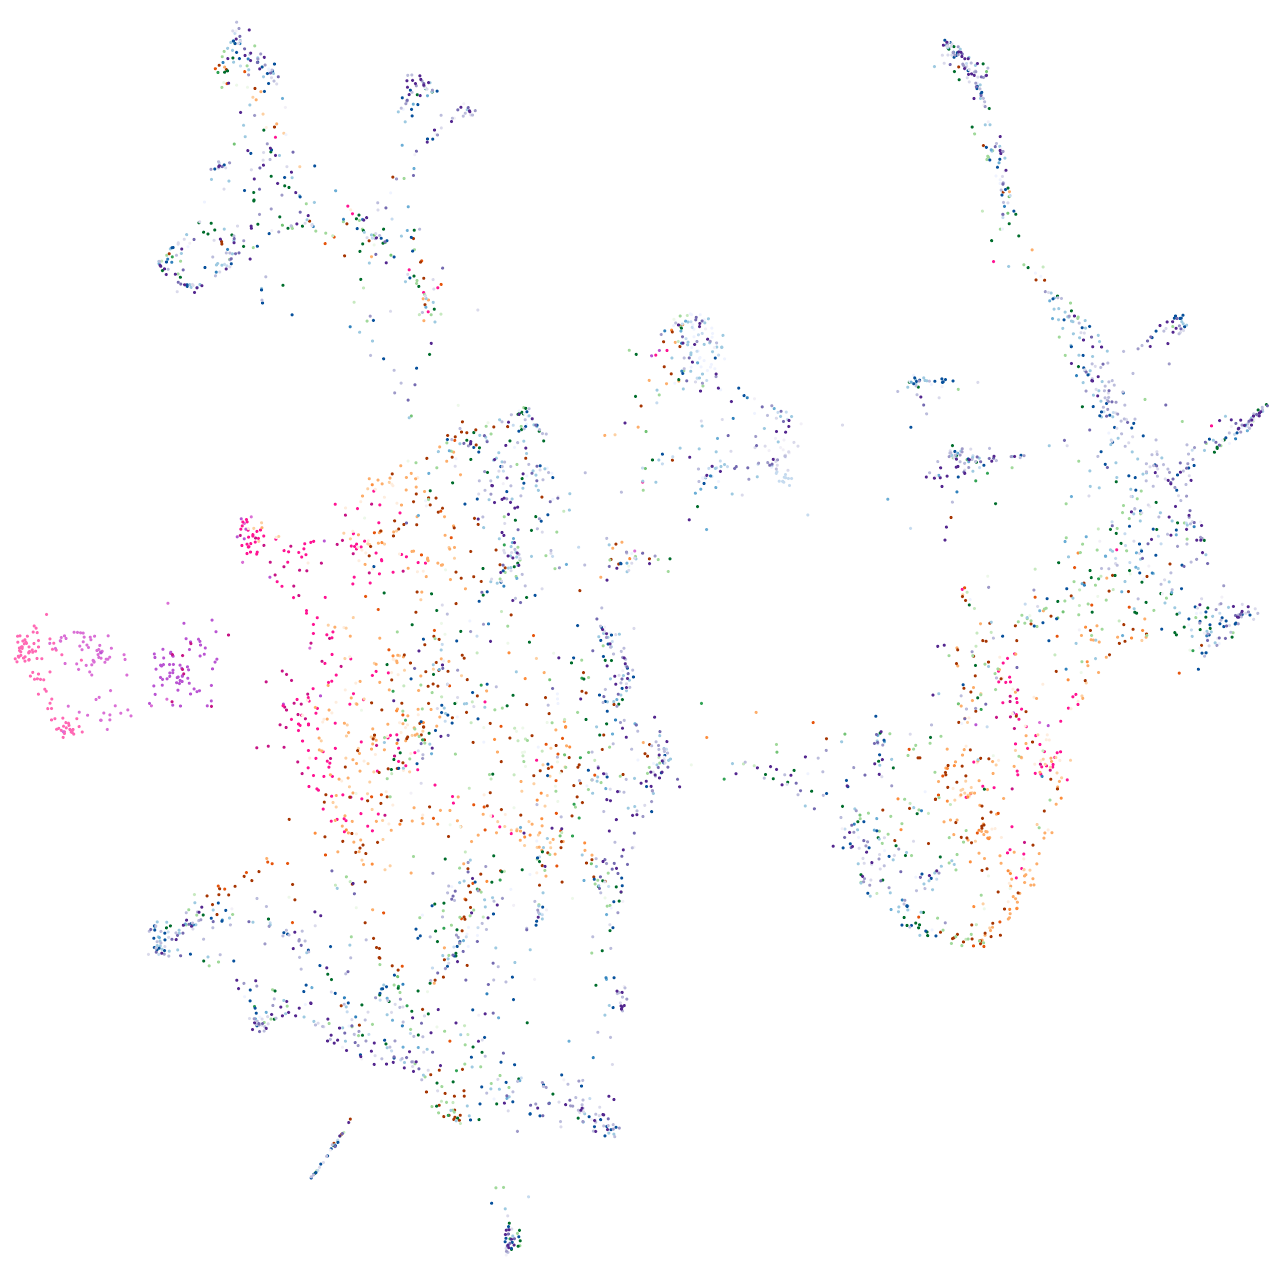
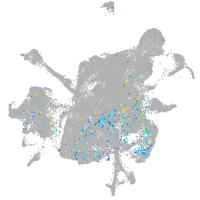
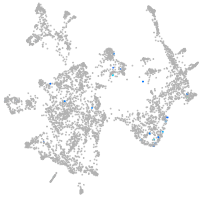
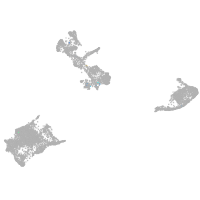
Expression by stage/cluster
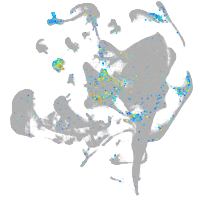
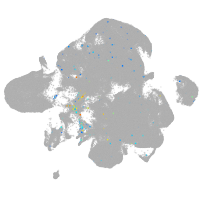
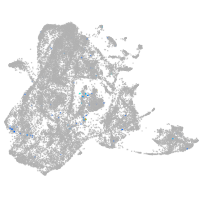
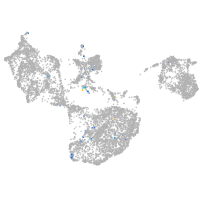
Correlated gene expression
Positive correlation
Negative correlation
Gene
r
Gene
r
snx10b
0.248
si:ch211-243g18.2
-0.052
CABZ01078858.1
0.243
stm
-0.043
ft2
0.222
sox10
-0.040
FO704673.1
0.220
atp2b1a
-0.038
FO834855.1
0.218
slc1a3a
-0.038
AL928866.2
0.198
stox1
-0.037
CT033796.1
0.194
agr2
-0.037
CR513789.1
0.194
mb
-0.036
BX510324.1
0.194
col2a1a
-0.035
XLOC-021942
0.192
ndufaf3
-0.035
BX005156.2
0.190
cyc1
-0.034
si:ch211-33e4.2
0.187
tbx2b
-0.034
btr26
0.186
hmga2
-0.034
LOC110440095
0.185
cadm4
-0.033
LOC110439545
0.182
mrpl21
-0.033
hsf5
0.180
si:dkey-98f17.3
-0.033
XLOC-026497
0.180
col9a2
-0.033
tbc1d13
0.178
cldna
-0.032
CR788226.1
0.177
prr15la
-0.032
LOC100535061
0.175
rorb
-0.032
XLOC-001767
0.175
gcnt4a
-0.032
LOC110439864
0.175
atp1b1a
-0.031
SGPP2
0.170
syncripl
-0.031
CABZ01066694.1
0.165
fxyd1
-0.030
rgs18
0.164
gstp1
-0.030
si:ch211-105n15.1
0.164
ptbp3
-0.030
tradv24.0.3
0.164
otomp
-0.030
peak3
0.164
rbm24a
-0.030
LOC101885188
0.160
galnt18b
-0.030
kif25
0.159
tnc
-0.029
LOC110437829
0.158
fbln7
-0.029
pcdh12
0.154
meis1b
-0.029
ms4a17a.6
0.153
bckdhb
-0.029
ccr9b
0.150
wbp11
-0.029
ryr2a
0.150
vgll4b
-0.029