Daniocell
ggcx (taste / olfactory)
gamma-glutamyl carboxylase
ZFIN
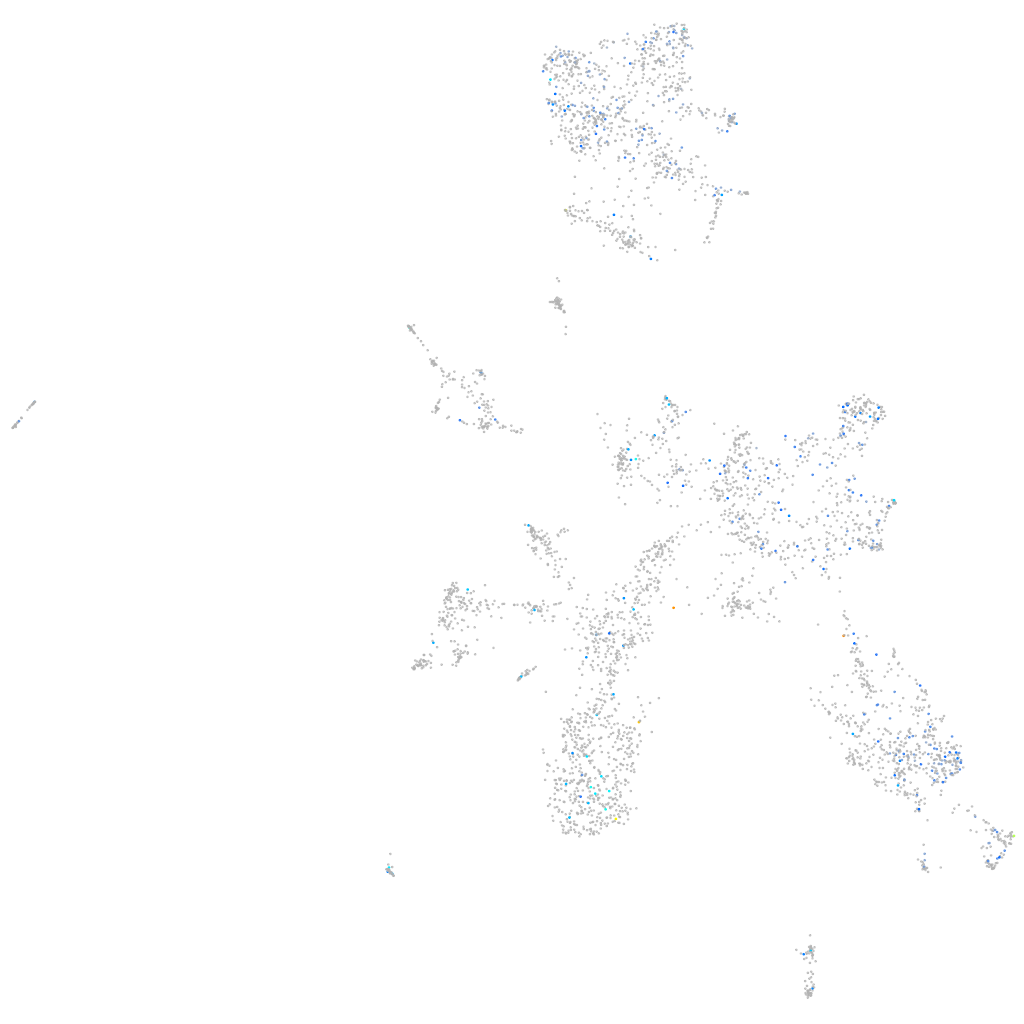
Gene expression UMAP
Display:
Expression
Stage
Other cell groups
all cells
blastomeres
PGCs
endoderm
axial mesoderm
muscle
mural cells /
non-skeletal muscle
mesenchyme
hematopoietic /
vasculature
pronephros
neural
spinal cord / glia
eye
taste / olfactory
otic / lateral line
epidermis
periderm
fin
ionocytes / mucous
pigment cells
Expression by stage/cluster
Correlated gene expression
Positive correlation
Negative correlation
Gene
r
Gene
r
ngs
0.201
slc25a5
-0.059
znfl1b
0.201
rpl21
-0.058
cngk
0.192
fthl27
-0.052
CABZ01064771.1
0.181
sox11a
-0.051
FO082779.2
0.174
tmsb
-0.051
XLOC-031547
0.169
rpl35
-0.050
plac8.2
0.163
rps29
-0.048
XLOC-036690
0.163
ppiab
-0.047
CU984579.1
0.160
h3f3d
-0.046
fap
0.159
phactr3a
-0.045
XLOC-028456
0.156
hbbe1.3
-0.044
LOC110439327
0.155
zc4h2
-0.044
FO904898.4
0.154
ptmab
-0.044
si:dkey-219c10.4
0.154
cd99l2
-0.044
slc44a5b
0.153
ebf2
-0.043
ccdc162
0.152
rpl38
-0.043
CR589947.2
0.149
dpysl2b
-0.042
CR848683.1
0.137
bcl7a
-0.042
si:dkey-96l17.6
0.136
egln1b
-0.042
atp6v1c2
0.134
myhz1.3
-0.042
RF00322
0.133
elavl3
-0.042
atp1a2a
0.132
atp1a3a
-0.041
si:ch1073-90m23.1
0.132
rab1bb
-0.041
si:dkey-37o8.1
0.131
tmem35
-0.041
LOC110439824
0.131
h2afvb
-0.041
lpar1
0.131
rpl32
-0.041
cntnap3
0.130
ncbp2
-0.040
sema3d
0.126
si:dkeyp-117h8.2
-0.040
layna
0.125
atp2a1
-0.040
AL928824.1
0.124
stmn1b
-0.040
ctsk
0.123
hbae1.1
-0.039
si:dkeyp-35e5.10
0.121
tubb5
-0.039
PEBP4
0.121
rpl28
-0.039
emilin1a
0.120
kcnc3a
-0.039
si:dkey-264d12.4
0.119
odf2b
-0.039