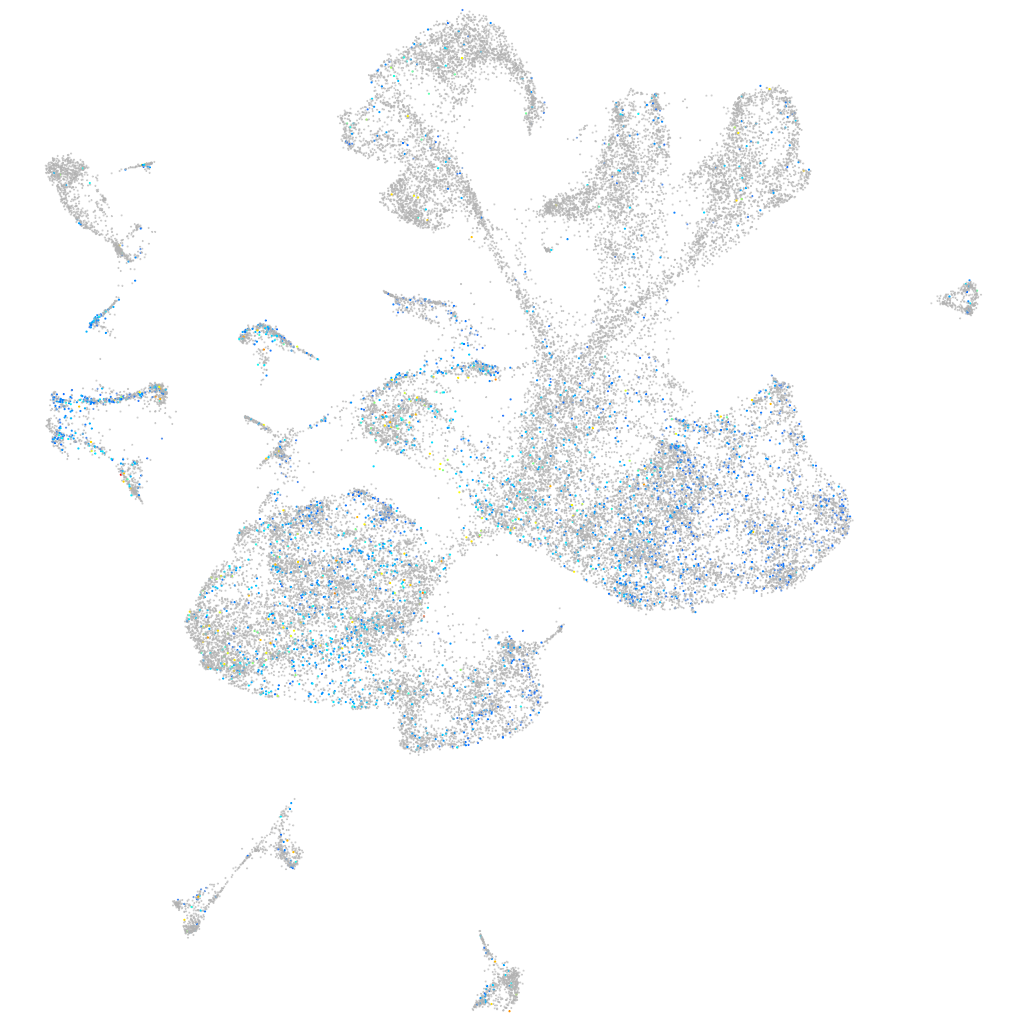
gamma-glutamyl carboxylase
ZFIN 
Expression by stage/cluster


Correlated gene expression


| Positive correlation | Negative correlation | ||
| Gene | r | Gene | r |
| igfbp7 | 0.110 | elavl3 | -0.106 |
| sparc | 0.107 | ptmaa | -0.099 |
| sulf1 | 0.105 | myt1b | -0.089 |
| asph | 0.101 | stmn1b | -0.084 |
| col2a1a | 0.100 | ptmab | -0.079 |
| plod3 | 0.100 | zc4h2 | -0.075 |
| col11a1a | 0.099 | rtn1a | -0.075 |
| col8a1a | 0.099 | myt1a | -0.073 |
| aplnr2 | 0.099 | tmsb | -0.072 |
| ntn1b | 0.099 | si:dkey-276j7.1 | -0.072 |
| ndnf | 0.099 | gng2 | -0.071 |
| col4a6 | 0.098 | LOC100537384 | -0.071 |
| atp1b4 | 0.098 | gng3 | -0.070 |
| cd81a | 0.098 | h3f3d | -0.068 |
| cd82a | 0.098 | elavl4 | -0.066 |
| atp1a1b | 0.097 | stxbp1a | -0.066 |
| ptprfb | 0.097 | nhlh2 | -0.065 |
| rcn3 | 0.097 | scrt2 | -0.065 |
| spon1b | 0.095 | sncb | -0.064 |
| metrnla | 0.095 | tubb5 | -0.064 |
| wls | 0.095 | jagn1a | -0.063 |
| si:ch1073-303k11.2 | 0.095 | vamp2 | -0.063 |
| fkbp9 | 0.095 | onecut1 | -0.062 |
| ctgfa | 0.095 | stx1b | -0.061 |
| col9a2 | 0.095 | onecut2 | -0.061 |
| fkbp14 | 0.094 | nsg2 | -0.060 |
| crtap | 0.094 | hmgb3a | -0.060 |
| fstl1b | 0.093 | pik3r3b | -0.060 |
| col9a1b | 0.092 | snap25a | -0.060 |
| optc | 0.092 | rtn1b | -0.059 |
| id1 | 0.091 | epb41a | -0.059 |
| hmga2 | 0.091 | ywhah | -0.058 |
| ptn | 0.091 | atcaya | -0.058 |
| cnn2 | 0.090 | cplx2 | -0.058 |
| slc1a3b | 0.090 | cbfa2t3 | -0.058 |


