Daniocell
ftr36 (ionocytes / mucous-producing)
"finTRIM family, member 36"
ZFIN
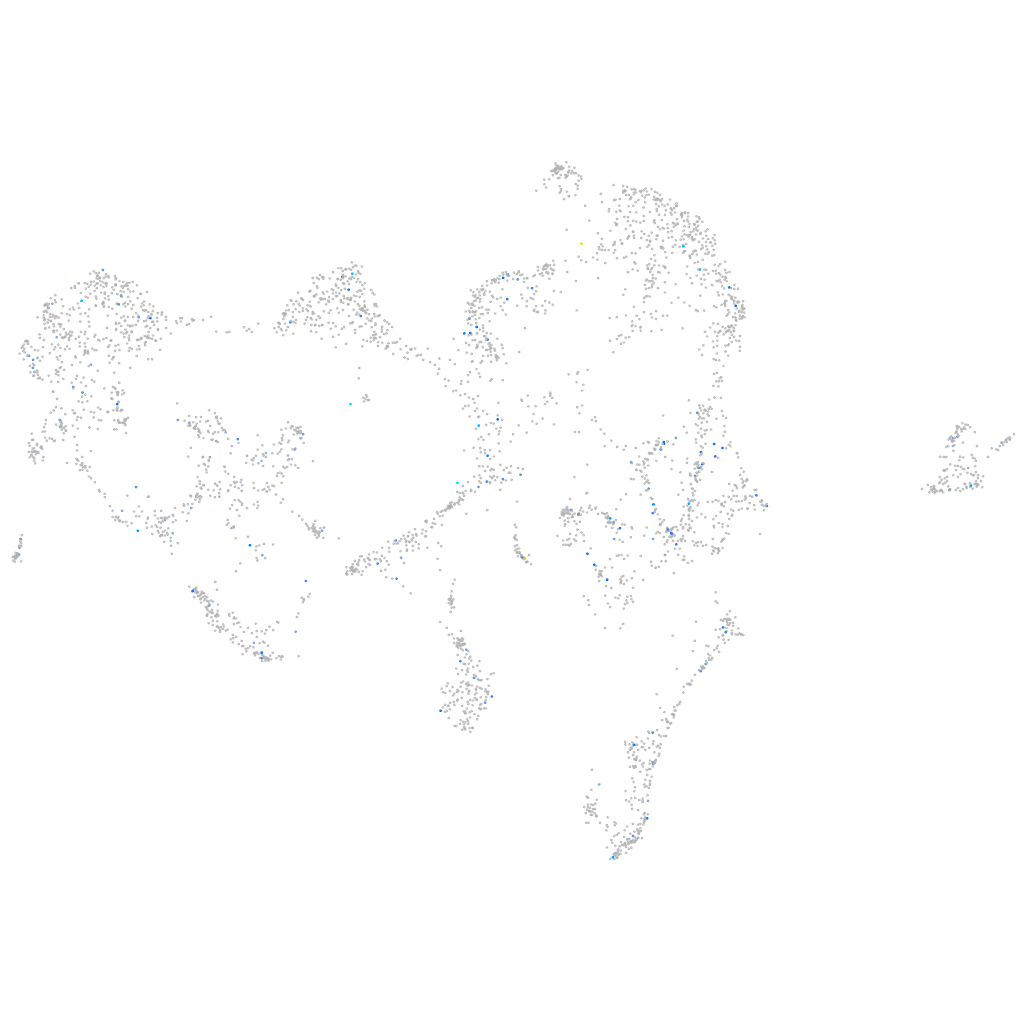
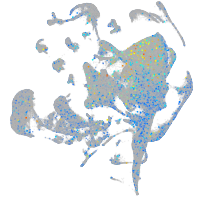
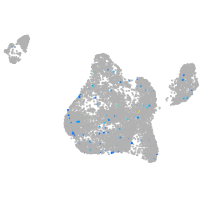
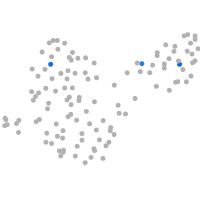
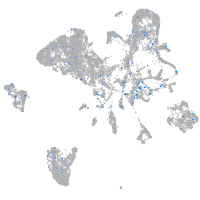
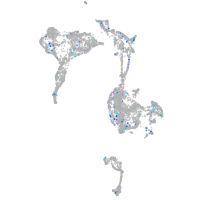
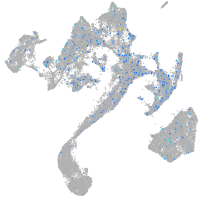
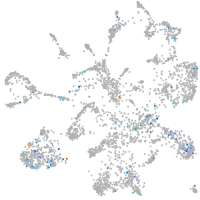
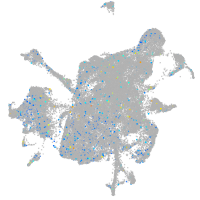
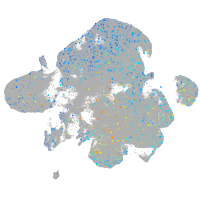
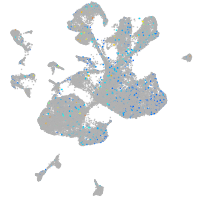
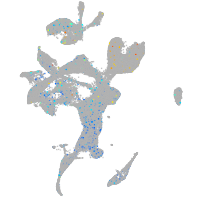
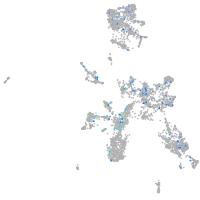
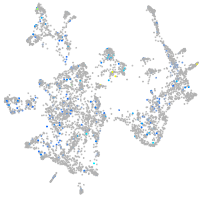
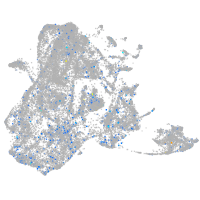
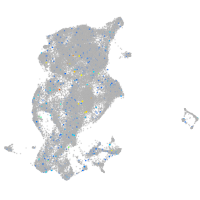
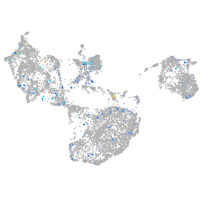
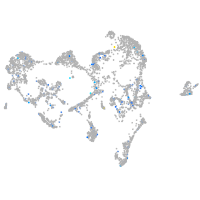
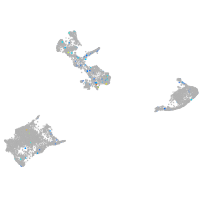
Gene expression UMAP
Display:
Expression
Stage
Other cell groups
all cells
blastomeres
PGCs
endoderm
axial mesoderm
muscle
mural cells /
non-skeletal muscle
mesenchyme
hematopoietic /
vasculature
pronephros
neural
spinal cord / glia
eye
taste / olfactory
otic / lateral line
epidermis
periderm
fin
ionocytes / mucous
pigment cells
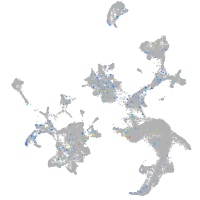
Expression by stage/cluster
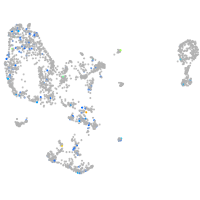
Correlated gene expression
Positive correlation
Negative correlation
Gene
r
Gene
r
galnt8a.1
0.285
grb10a
-0.056
erich3
0.271
wu:fi04e12
-0.053
si:dkey-91i10.3
0.238
atp2a3
-0.051
FP016247.2
0.233
icn
-0.049
tnni3k
0.231
si:dkey-65b12.6
-0.049
gal3st1a
0.218
BX000438.2
-0.048
si:dkey-19b23.14
0.215
muc5.1
-0.048
si:ch73-89b15.3
0.200
krt91
-0.047
BX001023.2
0.187
sytl2b
-0.047
znf1062
0.170
actc1b
-0.046
pecam1
0.167
golph3l
-0.044
LOC101882313
0.166
krt4
-0.043
NC-002333.22
0.165
capn2b
-0.043
gja5a
0.163
zgc:110333
-0.042
zgc:158423
0.162
LOC103910015
-0.042
sez6b
0.160
cers3b
-0.041
flt1
0.159
cd63
-0.041
fam129ab
0.154
muc5.2
-0.041
ecscr
0.153
tmsb1
-0.041
dgkh
0.150
tm9sf1
-0.041
mfsd10
0.145
itpr3
-0.041
hyal2a
0.144
rgs2
-0.040
CR392012.2
0.139
rasef
-0.040
zgc:194275
0.136
tp53bp2a
-0.039
LOC101885341
0.136
p2rx1
-0.039
LOC108182487
0.134
kita
-0.038
CR318603.2
0.133
LOC110438378
-0.038
si:ch211-191c10.1
0.132
elovl6l
-0.038
CT030144.1
0.131
zfx
-0.038
gabrr3a
0.131
b4galt4
-0.037
atf7ip2
0.129
pak6b
-0.037
trpv4
0.127
hbae3
-0.037
myct1b
0.127
cpeb4b
-0.037
XLOC-039757
0.124
crb3b
-0.037
klhl3
0.123
reps2
-0.036