Daniocell
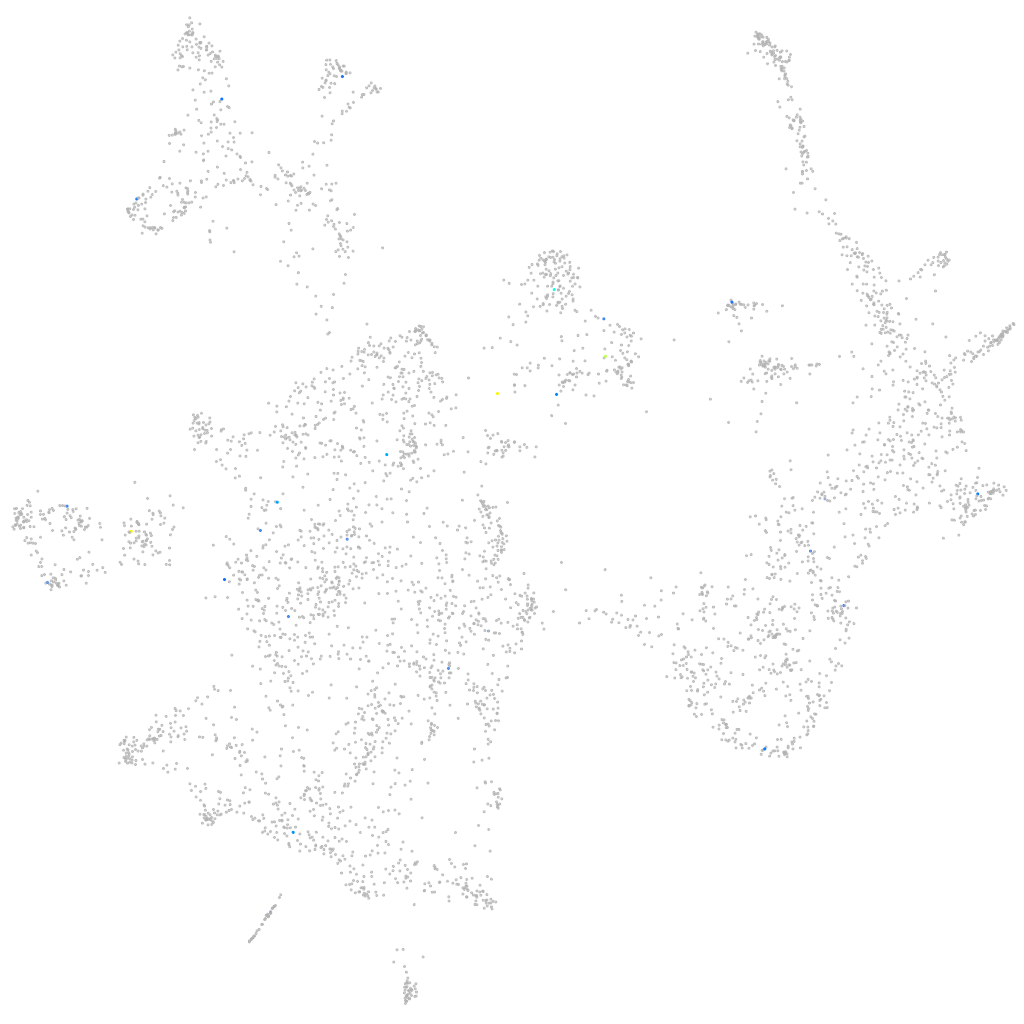
foxd3 (otic / lateral line)
forkhead box D3
ZFIN
Gene expression UMAP
Display:
Expression
Stage
Other cell groups
all cells
blastomeres
PGCs
endoderm
axial mesoderm
muscle
mural cells /
non-skeletal muscle
mesenchyme
hematopoietic /
vasculature
pronephros
neural
spinal cord / glia
eye
taste / olfactory
otic / lateral line
epidermis
periderm
fin
ionocytes / mucous
pigment cells
Expression by stage/cluster
Correlated gene expression
Positive correlation
Negative correlation
Gene
r
Gene
r
si:ch211-274k16.9
0.422
ybx1
-0.062
tfpi2
0.402
hspa8
-0.044
plscr3a
0.367
psma4
-0.039
si:ch211-244b2.4
0.360
eif4ebp2
-0.038
CABZ01092982.1
0.321
cox6c
-0.036
crhb
0.316
six1b
-0.036
kcnk2a
0.307
psmc1a
-0.035
XLOC-010379
0.295
arhgdia
-0.035
cacng5a
0.290
ndufa4l
-0.033
XLOC-044140
0.286
ccng1
-0.033
rilpl1
0.281
cox5aa
-0.033
her3
0.279
si:dkey-42i9.4
-0.032
gpr153
0.275
fam168a
-0.032
cldn11a
0.273
ywhaba
-0.032
si:ch211-161f7.2
0.272
junbb
-0.032
trhde.2
0.264
rpl18
-0.031
si:ch211-191j22.8
0.257
rpl13a
-0.031
kcng3
0.238
metap2b
-0.030
znfl1k
0.236
npc2
-0.030
CABZ01081294.1
0.236
col18a1a
-0.030
CSDC2 (1 of many)
0.235
dars
-0.030
grin2ab
0.226
hsdl2
-0.030
zgc:174564
0.225
ssr4
-0.030
sstr1a
0.224
nktr
-0.029
BX005254.3
0.223
fthl27
-0.029
NPFFR2
0.220
bcam
-0.029
mir132-1
0.215
rps27.1
-0.029
zgc:154093
0.214
rps26
-0.029
neurod6a
0.212
ddx5
-0.029
LOC110438283
0.209
nedd8
-0.029
CABZ01048956.1
0.208
ginm1
-0.029
rab38c
0.207
selenot1a
-0.029
LOC103910909
0.204
rps15a
-0.029
si:dkey-221l4.11
0.197
psmd4b
-0.029
zgc:114181
0.196
hadhb
-0.029