Daniocell
fnip1 (fin)
folliculin interacting protein 1
ZFIN
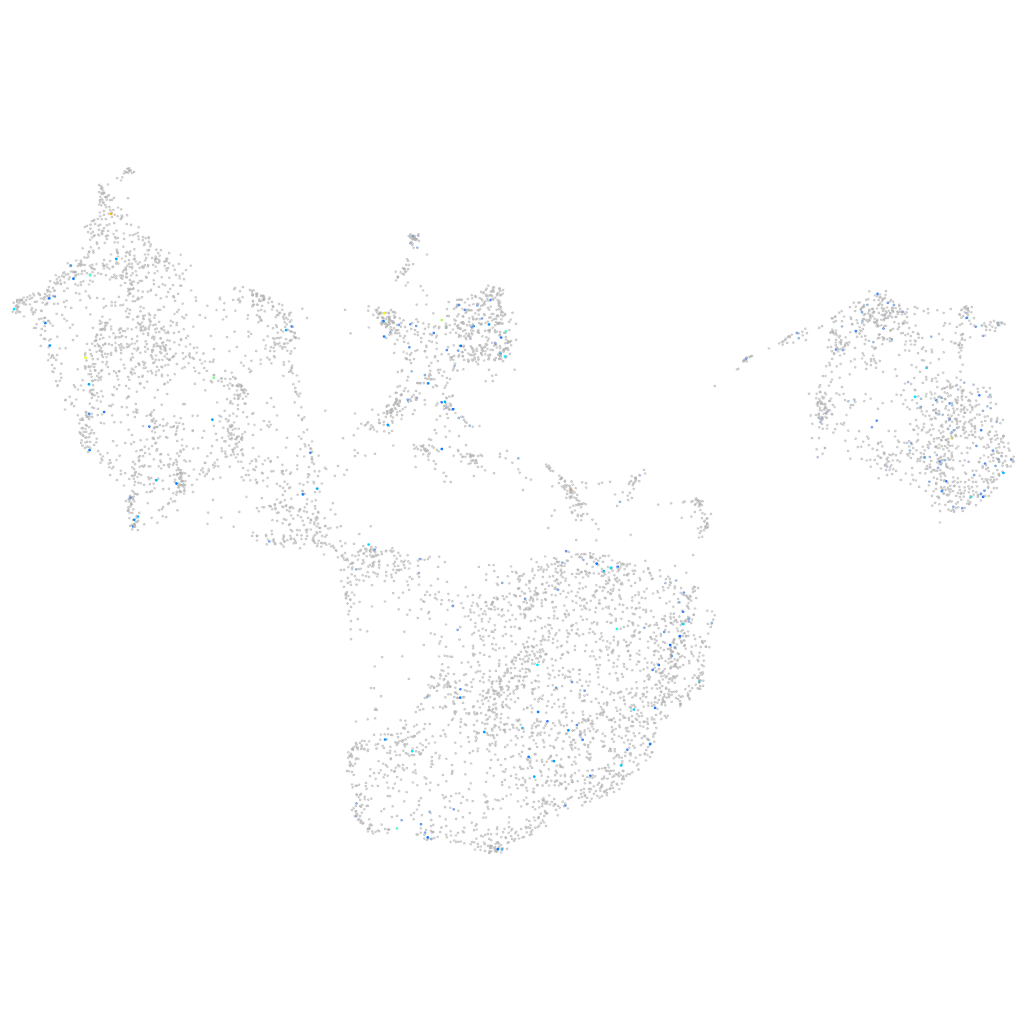
Gene expression UMAP
Display:
Expression
Stage
Other cell groups
all cells
blastomeres
PGCs
endoderm
axial mesoderm
muscle
mural cells /
non-skeletal muscle
mesenchyme
hematopoietic /
vasculature
pronephros
neural
spinal cord / glia
eye
taste / olfactory
otic / lateral line
epidermis
periderm
fin
ionocytes / mucous
pigment cells
Expression by stage/cluster
Correlated gene expression
Positive correlation
Negative correlation
Gene
r
Gene
r
si:dkey-176f19.4
0.189
rpl19
-0.043
parietopsin
0.184
pdia4
-0.042
LOC103910556
0.176
rps13
-0.041
BX323076.2
0.166
xbp1
-0.040
si:dkey-201l21.4
0.166
slc39a7
-0.037
LOC103910512
0.157
smim12
-0.035
znf1172
0.152
rps2
-0.034
BX284620.1
0.150
sri
-0.034
grap2a
0.150
zgc:66479
-0.034
avpr1aa
0.146
taf11
-0.032
avpr1ab
0.146
tpt1
-0.032
LOC103910996
0.143
ier3ip1
-0.031
tlx3b
0.140
lhfpl2a
-0.031
XLOC-006868
0.139
msx2b
-0.031
hprt1l
0.135
si:ch211-194k22.8
-0.031
zgc:194906.1
0.134
hsd3b7
-0.031
si:ch211-241j12.3
0.131
rhebl1
-0.030
LOC108190755
0.129
rps12
-0.030
CABZ01049825.1
0.127
tram2
-0.030
hcn4l
0.126
napab
-0.030
znf804a
0.123
dynll1
-0.030
jak3
0.122
rps20
-0.030
LO018303.1
0.118
ufc1
-0.030
LOC103910031
0.117
ift20
-0.030
cryba2a
0.116
si:ch211-107n13.1
-0.029
ctss1
0.115
fkbp7
-0.029
cnn1a
0.113
ppa1b
-0.029
trpm5
0.113
hoxa13b
-0.029
si:dkey-27l15.1
0.112
eva1ba
-0.029
si:ch211-205a14.3
0.112
ralbb
-0.028
rph3aa
0.112
rps11
-0.028
cnksr2a
0.112
zfpl1
-0.028
si:dkey-56i24.1
0.111
asna1
-0.028
FAM124A
0.111
rgl1
-0.028
LOC103909138
0.111
rpl27a
-0.028