Daniocell
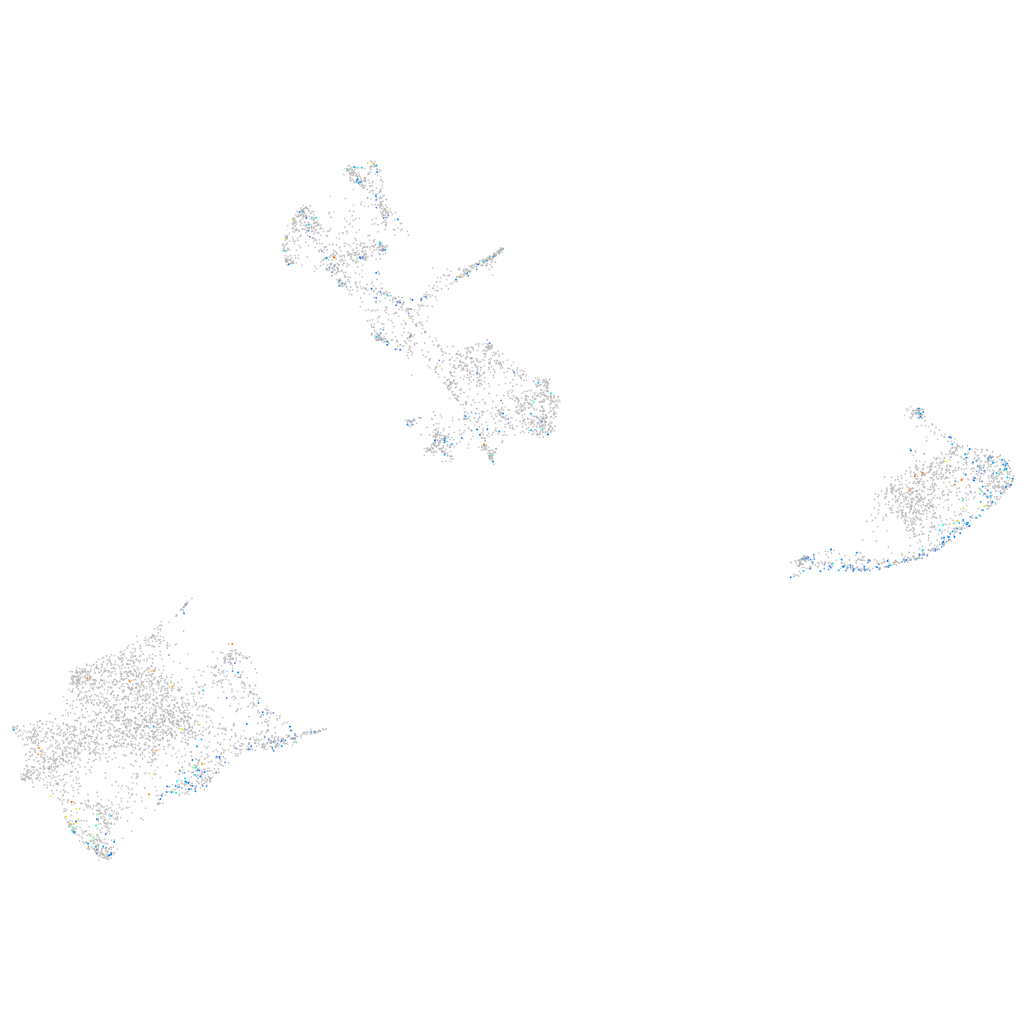
fnip1 (pigment cells)
folliculin interacting protein 1
ZFIN
Gene expression UMAP
Display:
Expression
Stage
Other cell groups
all cells
blastomeres
PGCs
endoderm
axial mesoderm
muscle
mural cells /
non-skeletal muscle
mesenchyme
hematopoietic /
vasculature
pronephros
neural
spinal cord / glia
eye
taste / olfactory
otic / lateral line
epidermis
periderm
fin
ionocytes / mucous
pigment cells
Expression by stage/cluster
Correlated gene expression
Positive correlation
Negative correlation
Gene
r
Gene
r
trpm1b
0.162
si:dkey-251i10.2
-0.068
SPAG9
0.162
CABZ01021592.1
-0.066
cbln10
0.142
rplp0
-0.060
cpeb1b
0.142
rpl7
-0.053
LOC108183855
0.133
tmsb
-0.052
kiaa1549lb
0.133
rpl19
-0.052
CR383676.1
0.133
paics
-0.051
RF00030
0.131
rps14
-0.048
or109-11
0.127
si:dkey-151g10.6
-0.048
CABZ01072614.1
0.123
rpl31
-0.045
si:ch211-215k15.4
0.123
hbae3
-0.045
bhlhe41
0.120
rps7
-0.044
CR847566.1
0.117
gch2
-0.044
klf6a
0.117
rplp1
-0.044
LOC101886275
0.116
rps12
-0.044
pcdh10a
0.116
rpl21
-0.043
LOC103909978
0.115
hbbe1.3
-0.042
opn5
0.113
rps5
-0.042
atp11a
0.112
hbae1.1
-0.042
si:dkeyp-61b2.1
0.110
rpl8
-0.040
FO681288.3
0.110
rps2
-0.040
CU571315.3
0.109
elavl3
-0.039
inka1b
0.108
tuba1c
-0.039
LOC108182764
0.108
tnni2a.4
-0.038
ctsla
0.108
cyt1l
-0.038
si:ch211-195b13.1
0.108
prdx5
-0.037
scarb2a
0.107
ptmaa
-0.037
si:zfos-943e10.1
0.107
si:ch211-222l21.1
-0.037
XLOC-023300
0.107
actc1b
-0.036
arhgef33
0.107
faua
-0.036
pcdh9
0.106
mdh1aa
-0.036
ostm1
0.105
prdx1
-0.035
zdhhc15a
0.105
tmem130
-0.035
bhlhe40
0.105
XLOC-003689
-0.034
adcy5
0.105
rpl27
-0.034