Daniocell
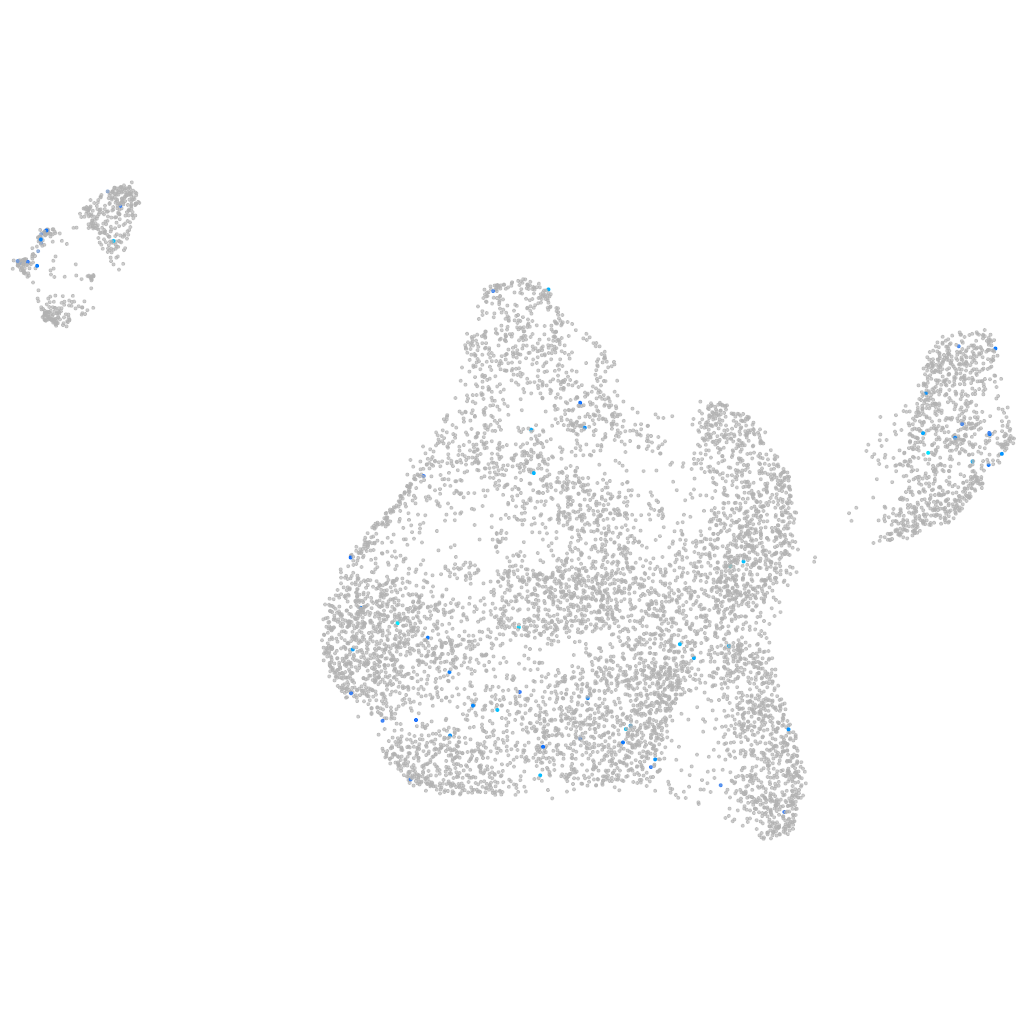
fnip1 (blastomeres)
folliculin interacting protein 1
ZFIN
Gene expression UMAP
Display:
Expression
Stage
Other cell groups
all cells
blastomeres
PGCs
endoderm
axial mesoderm
muscle
mural cells /
non-skeletal muscle
mesenchyme
hematopoietic /
vasculature
pronephros
neural
spinal cord / glia
eye
taste / olfactory
otic / lateral line
epidermis
periderm
fin
ionocytes / mucous
pigment cells
Expression by stage/cluster
Correlated gene expression
Positive correlation
Negative correlation
Gene
r
Gene
r
tgm8
0.171
rps15a
-0.043
frmpd1b
0.169
hspb1
-0.038
CR848791.1
0.167
ilf2
-0.035
XLOC-027877
0.164
si:ch211-152c2.3
-0.034
lhx2a
0.163
rpl32
-0.033
meox1
0.154
marcksl1b
-0.032
si:ch1073-185p12.2
0.137
srsf5a
-0.032
cyp26c1
0.134
eif5
-0.031
FP085421.1
0.132
uba52
-0.031
XLOC-024377
0.131
polr2h
-0.031
LOC101885890
0.131
rpl35a
-0.031
LOC110438151
0.131
eef1a1l1
-0.031
si:ch211-59p23.1
0.130
nup50
-0.031
flrt1b
0.130
hnrnpa0b
-0.031
dhrs7ca
0.125
vrtn
-0.031
si:dkey-223p19.1
0.119
dynll1
-0.030
dpep2
0.118
med6
-0.029
CT009620.1
0.117
sltm
-0.029
si:ch211-241j8.2
0.115
slc25a3b
-0.029
XLOC-037556
0.112
ppp1r10
-0.029
LOC101887036
0.111
atp1b1a
-0.029
gzm3.2
0.104
uqcrh
-0.029
CR847899.2
0.103
zgc:92664
-0.029
esamb
0.103
rpl26
-0.028
CR762475.1
0.101
rpl30
-0.028
clrn1
0.100
LEPROTL1
-0.028
LOC110438422
0.098
mcm4
-0.028
BX248515.2
0.095
XLOC-031067
-0.028
cdhr5a
0.091
gnl3
-0.027
kcng4a
0.090
psmb4
-0.027
CR626887.1
0.090
cct3
-0.027
cnga3a
0.090
psma3
-0.027
si:ch211-207j7.2
0.088
ctnnb1
-0.027
cyp2ae1
0.085
zgc:110425
-0.027
LOC100332354
0.085
snrpb
-0.026