Daniocell
fer (taste / olfactory)
fer (fps/fes related) tyrosine kinase
ZFIN
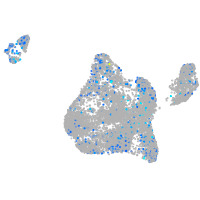
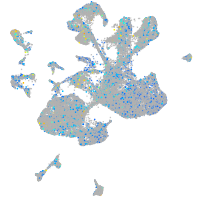
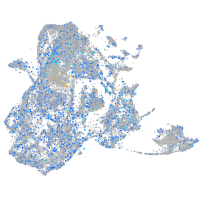
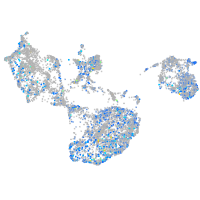
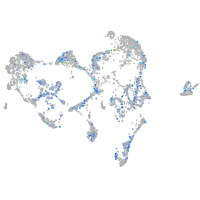
Gene expression UMAP
Display:
Expression
Stage
Other cell groups
all cells
blastomeres
PGCs
endoderm
axial mesoderm
muscle
mural cells /
non-skeletal muscle
mesenchyme
hematopoietic /
vasculature
pronephros
neural
spinal cord / glia
eye
taste / olfactory
otic / lateral line
epidermis
periderm
fin
ionocytes / mucous
pigment cells
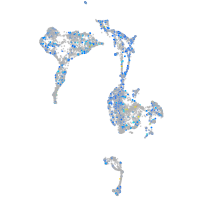
Expression by stage/cluster
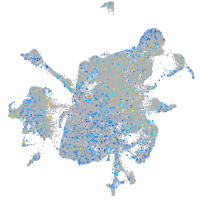
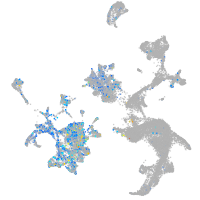
Correlated gene expression
Positive correlation
Negative correlation
Gene
r
Gene
r
si:ch211-194p6.10
0.168
LOC100537342
-0.080
ppp1r16b
0.150
fabp10b
-0.080
slc17a7a
0.147
insm1a
-0.079
LOC110438077
0.141
fthl31
-0.078
CU929294.1
0.139
adcyap1b
-0.075
LOC110439879
0.138
sncb
-0.075
CABZ01077956.1
0.132
si:ch211-237l4.6
-0.075
LOC100001908
0.128
gnao1b
-0.073
kctd12b
0.127
zgc:65894
-0.072
adcyap1r1b
0.126
pvalb5
-0.071
ahnak
0.125
abhd2b
-0.070
LOC110438136
0.122
elavl3
-0.069
sox2
0.121
tmed8
-0.069
fmn2a
0.121
chga
-0.068
pea15
0.120
si:ch211-153b23.5
-0.068
CR848683.1
0.118
ropn1l
-0.068
adgra2
0.118
si:rp71-17i16.6
-0.067
zgc:136908
0.118
atp2b1b
-0.067
LOC101886471
0.116
enkur
-0.066
sox10
0.116
fstl5
-0.066
CR847534.1
0.114
tspan2a
-0.065
zgc:112332
0.113
nell2a
-0.064
XLOC-031547
0.113
s100z
-0.064
cdc42ep5
0.113
mycbp
-0.063
BX005254.3
0.112
hpcal4
-0.063
krt18a.1
0.112
hbae3
-0.063
LOC110438502
0.111
sprn2
-0.062
aplnrb
0.111
rtn1a
-0.062
pald1a
0.111
eno1b
-0.062
iqgap1
0.111
nhlh2
-0.061
soat2
0.111
uncx4.1
-0.061
CU914602.1
0.110
lhx2a
-0.061
si:ch211-238e22.5
0.110
rgs8
-0.060
LOC101884238
0.110
gsna
-0.059
tmcc3
0.108
fthl30
-0.059