
Unc4.1 homeobox (C. elegans)
ZFIN 
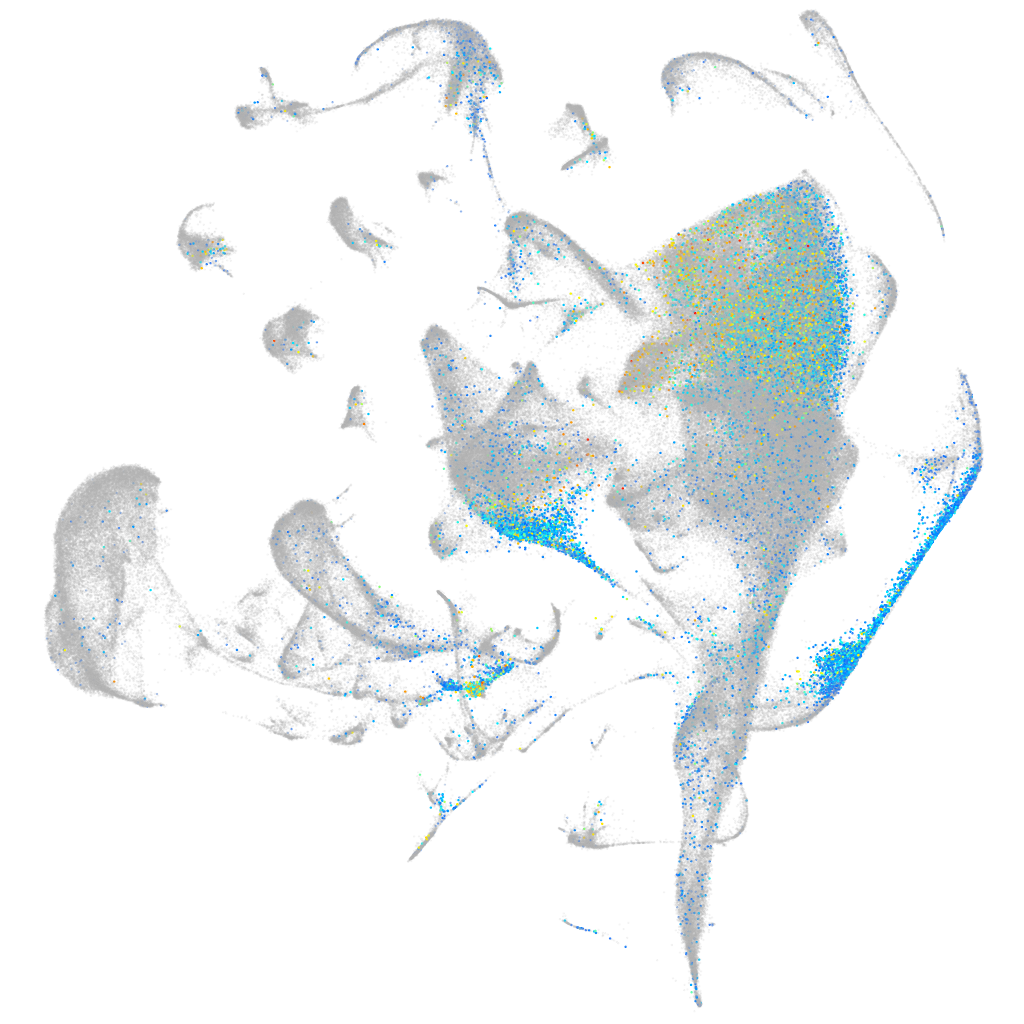
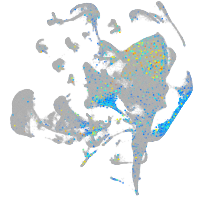
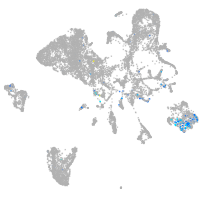
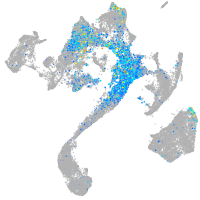
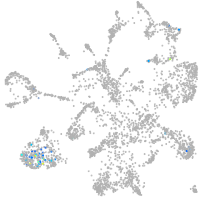
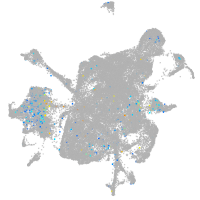
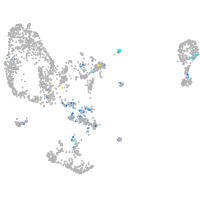
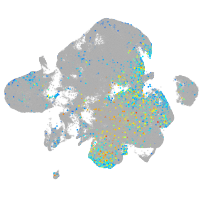
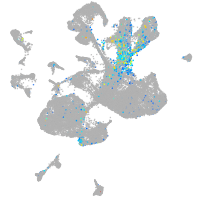
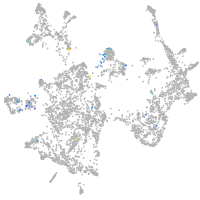
Gene expression UMAP


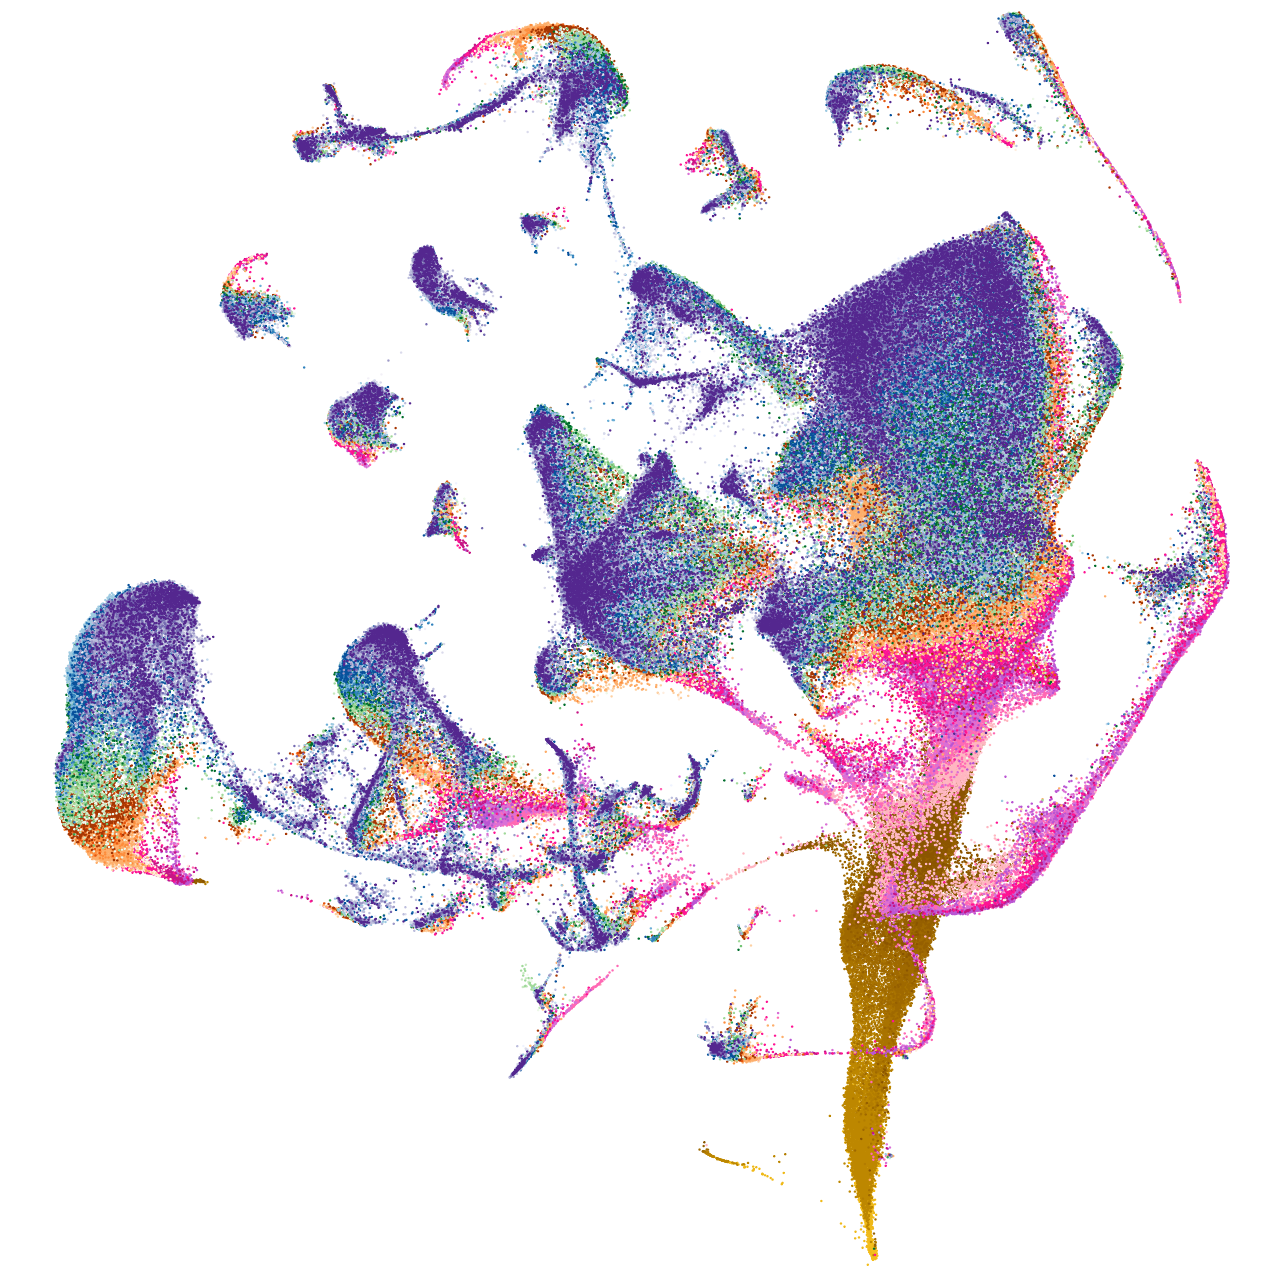


Expression by stage/cluster
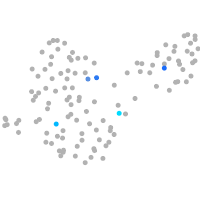
Correlated gene expression
| Positive correlation | Negative correlation | ||
| Gene | r | Gene | r |
| uncx | 0.336 | eef1da | -0.084 |
| scrt1a | 0.228 | aldob | -0.081 |
| elavl3 | 0.207 | cfl1l | -0.074 |
| lhx1a | 0.179 | capns1a | -0.071 |
| myt1b | 0.178 | tuba8l | -0.070 |
| stmn1b | 0.177 | hdlbpa | -0.069 |
| tmeff1b | 0.173 | pfn1 | -0.069 |
| rtn1a | 0.170 | fosab | -0.068 |
| tcf15 | 0.167 | s100a10b | -0.067 |
| tmsb | 0.166 | zgc:162730 | -0.067 |
| ebf3a | 0.164 | ccng1 | -0.065 |
| nhlh2 | 0.163 | krt5 | -0.064 |
| hmgb3a | 0.155 | sdc4 | -0.064 |
| myt1a | 0.155 | tpm3 | -0.064 |
| rbp7b | 0.155 | cd63 | -0.063 |
| atcaya | 0.154 | msna | -0.063 |
| tubb5 | 0.154 | pcna | -0.063 |
| si:ch73-386h18.1 | 0.153 | pycard | -0.063 |
| gdf11 | 0.152 | s100v2 | -0.063 |
| adam22 | 0.149 | anxa2a | -0.062 |
| si:dkey-276j7.1 | 0.145 | zgc:175088 | -0.062 |
| stap2a | 0.145 | anxa1a | -0.061 |
| tuba1c | 0.145 | ccnd1 | -0.061 |
| insm1b | 0.143 | cd9b | -0.061 |
| jpt1b | 0.143 | zgc:110339 | -0.061 |
| fez1 | 0.142 | ckap4 | -0.060 |
| dpysl3 | 0.141 | si:dkey-16p21.8 | -0.060 |
| lhx5 | 0.141 | tmsb1 | -0.060 |
| celf3a | 0.140 | zfp36l1a | -0.060 |
| zc4h2 | 0.140 | cast | -0.059 |
| ywhah | 0.139 | cst14b.1 | -0.059 |
| scrt2 | 0.138 | si:ch211-166a6.5 | -0.059 |
| vwde | 0.138 | sult6b1 | -0.059 |
| gng2 | 0.137 | zgc:153284 | -0.059 |
| gng3 | 0.137 | aldh9a1a.1 | -0.058 |