Daniocell
esyt2b (pronephros)
extended synaptotagmin-like protein 2b
ZFIN
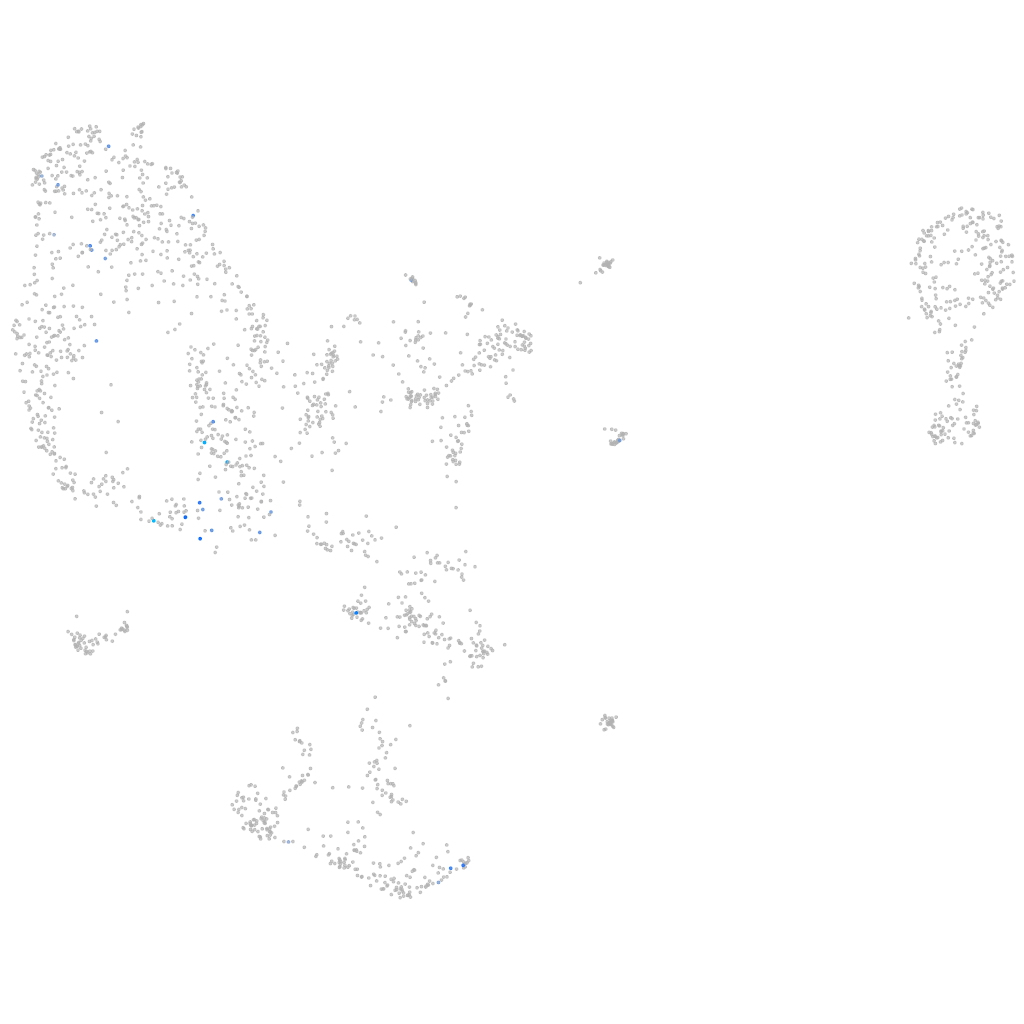
Gene expression UMAP
Display:
Expression
Stage
Other cell groups
all cells
blastomeres
PGCs
endoderm
axial mesoderm
muscle
mural cells /
non-skeletal muscle
mesenchyme
hematopoietic /
vasculature
pronephros
neural
spinal cord / glia
eye
taste / olfactory
otic / lateral line
epidermis
periderm
fin
ionocytes / mucous
pigment cells
Expression by stage/cluster
Correlated gene expression
Positive correlation
Negative correlation
Gene
r
Gene
r
si:ch211-76m11.9
0.373
hmgb1a
-0.065
senp6b
0.353
hmgb3a
-0.059
XLOC-036545
0.309
marcksb
-0.058
LOC101882122
0.289
denr
-0.057
si:dkey-16m19.1
0.261
si:ch211-51e12.7
-0.055
LOC100538177
0.261
marcksl1b
-0.054
LOC108181393
0.249
nop10
-0.054
LO017643.1
0.249
pdap1a
-0.051
XLOC-037389
0.238
nop56
-0.051
OSCP1 (1 of many)
0.237
rpl3
-0.051
BX511018.2
0.228
wu:fb97g03
-0.050
tent5ab
0.227
seta
-0.050
si:dkey-7j22.1
0.220
hspb1
-0.050
BX957347.1
0.215
pomp
-0.050
mmp20b
0.215
ddx18
-0.050
CABZ01056843.1
0.212
sumo3b
-0.050
gsg1l
0.207
cdkn2aipnl
-0.049
taar20a1
0.205
rwdd1
-0.048
ptgis
0.199
ubxn1
-0.048
XLOC-007246
0.199
top1l
-0.048
vcanb
0.195
dkc1
-0.048
AL935186.2
0.188
tuba1a
-0.048
si:dkey-13n23.3.1
0.187
rcc2
-0.047
LOC101886665
0.185
cirbpa
-0.047
LOC100537721
0.182
nop58
-0.047
LOC100007686
0.181
fbl
-0.047
xirp2b
0.179
hnrnpa0a
-0.047
BX649490.1
0.177
abcf1
-0.047
kel
0.167
snu13b
-0.047
si:cabz01076231.1
0.166
u2af1
-0.046
si:dkey-243k1.3
0.166
phf5a
-0.046
hyal2a
0.164
wdr5
-0.046
lactb2
0.164
dek
-0.046
duox
0.161
anp32b
-0.046
si:ch211-125m10.6
0.160
sf3b4
-0.046