Daniocell
esyt2b (hematopoietic / vasculature)
extended synaptotagmin-like protein 2b
ZFIN
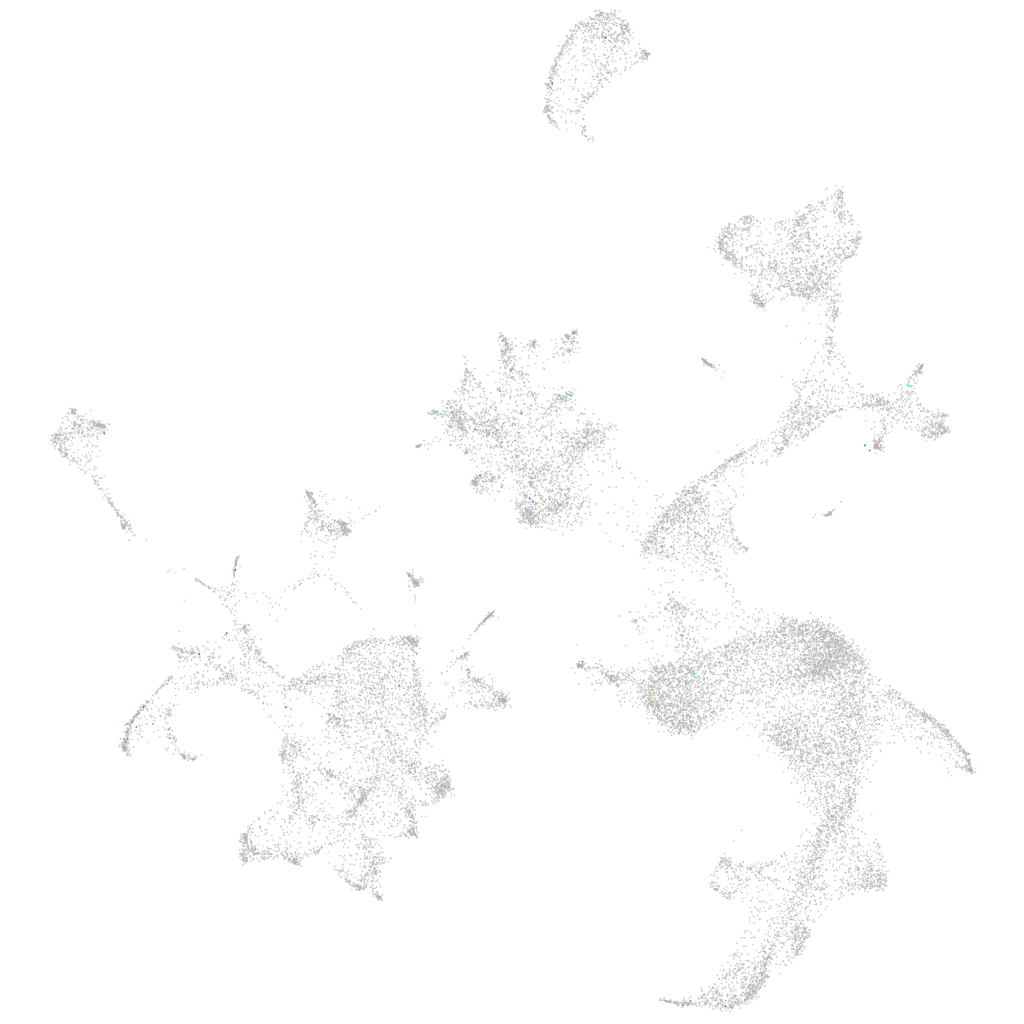
Gene expression UMAP
Display:
Expression
Stage
Other cell groups
all cells
blastomeres
PGCs
endoderm
axial mesoderm
muscle
mural cells /
non-skeletal muscle
mesenchyme
hematopoietic /
vasculature
pronephros
neural
spinal cord / glia
eye
taste / olfactory
otic / lateral line
epidermis
periderm
fin
ionocytes / mucous
pigment cells
Expression by stage/cluster
Correlated gene expression
Positive correlation
Negative correlation
Gene
r
Gene
r
stard5
0.214
ponzr1
-0.016
CABZ01117780.1
0.184
clic1
-0.015
BX649337.1
0.168
fabp11a
-0.015
adgrf3a
0.162
ctsz
-0.015
LOC101885457
0.155
XLOC-014079
-0.014
si:ch73-306e8.2
0.143
cpn1
-0.014
CR925713.1
0.140
egfl7
-0.014
XLOC-036897
0.132
pcdh12
-0.014
FP016012.1
0.129
cdh5
-0.014
XLOC-023755
0.120
rab8b
-0.014
grid1b
0.114
ecscr
-0.014
BX510301.2
0.114
slc9a3r1b
-0.014
fam155b
0.111
pitpnaa
-0.014
XLOC-023835
0.110
plvapb
-0.013
CABZ01084942.1
0.103
arhgap31
-0.013
si:dkey-156m2.3
0.103
ednraa
-0.013
rnf212
0.102
stab1
-0.013
BX005156.1
0.101
si:ch211-248e11.2
-0.013
v2rh13
0.101
ldb2a
-0.013
LOC101885088
0.100
ptprb
-0.013
si:dkey-215k6.1
0.099
cndp2
-0.013
CT956093.1
0.098
gabarapa
-0.013
CU463038.2
0.097
si:dkey-126g1.9
-0.013
grin2cb
0.097
tmem88a
-0.013
si:dkey-197j19.6
0.096
lrrc8da
-0.013
LOC108190012
0.095
si:dkey-27i16.2
-0.013
nptxra
0.095
marveld1
-0.013
tmem184bb
0.093
CR293511.1
-0.012
pcsk1
0.092
fmnl3
-0.012
XLOC-008202
0.092
fli1b
-0.012
si:ch73-299h12.1
0.089
ccdc80
-0.012
mcf2lb
0.087
sgk1
-0.012
si:ch211-282j17.8
0.086
XLOC-011085
-0.012
si:dkey-88n24.8
0.086
dub
-0.012
si:dkey-28d5.10
0.086
XLOC-039757
-0.012