Daniocell
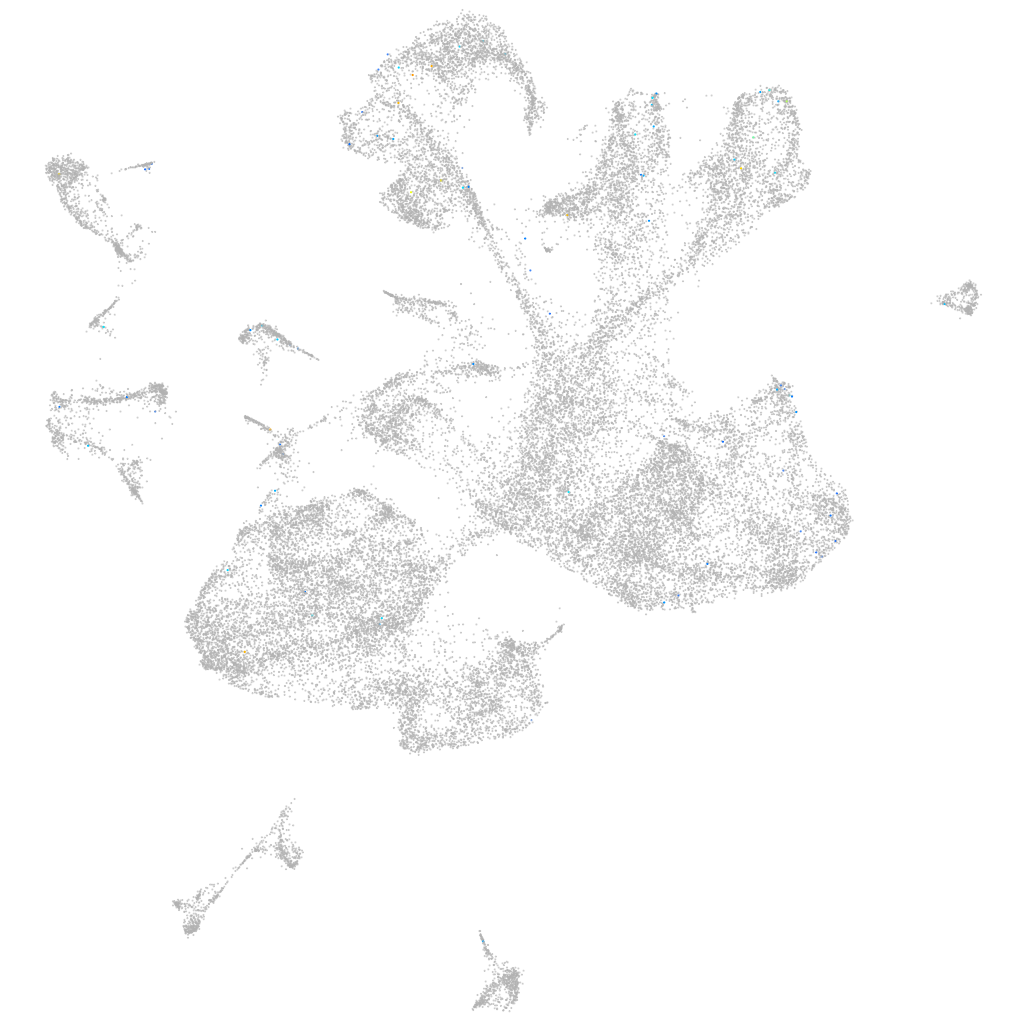
esyt2b (glial cells / spinal cord)
extended synaptotagmin-like protein 2b
ZFIN
Gene expression UMAP
Display:
Expression
Stage
Other cell groups
all cells
blastomeres
PGCs
endoderm
axial mesoderm
muscle
mural cells /
non-skeletal muscle
mesenchyme
hematopoietic /
vasculature
pronephros
neural
spinal cord / glia
eye
taste / olfactory
otic / lateral line
epidermis
periderm
fin
ionocytes / mucous
pigment cells
Expression by stage/cluster
Correlated gene expression
Positive correlation
Negative correlation
Gene
r
Gene
r
BX324153.1
0.206
sb:cb81
-0.027
CR762470.1
0.138
her15.1
-0.026
wdr38
0.125
rps20
-0.025
si:dkey-238o14.3
0.122
rpl26
-0.025
si:dkey-283j8.1
0.110
XLOC-003689
-0.025
mir459
0.104
sox3
-0.024
si:ch73-7i4.2
0.099
hmgb2b
-0.024
BX649516.3
0.097
rps4x
-0.023
si:ch73-233f7.5
0.088
snrpf
-0.023
c1qb
0.086
CU467822.1
-0.023
XLOC-008016
0.083
notch3
-0.023
LOC101884216
0.083
notch1b
-0.022
f2r
0.081
XLOC-003690
-0.022
zgc:55888
0.077
CU634008.1
-0.022
CR339059.1
0.076
rps13
-0.022
XLOC-034224
0.075
alyref
-0.022
LOC103911141
0.075
rps21
-0.022
sult1st3
0.074
rpl27
-0.022
BX322665.2
0.073
rplp2l
-0.022
cacng1b
0.072
hmga1a
-0.022
ndr2
0.072
rps15a
-0.021
FP017151.1
0.070
hmgb2a
-0.021
LOC110439889
0.068
ybx1
-0.021
CABZ01079853.1
0.067
rps3a
-0.021
LOC565905
0.066
her4.2
-0.021
CR855311.2
0.066
naca
-0.021
calcr
0.066
eef1a1l1
-0.020
CR854897.1
0.065
XLOC-003692
-0.020
LOC101882689
0.064
zgc:165461
-0.020
CU693471.1
0.064
rps19
-0.020
CT573494.1
0.064
COX7A2 (1 of many)
-0.020
LOC101885083
0.063
zeb2a
-0.020
si:ch211-229i14.2
0.063
rpl10
-0.020
LOC108191316
0.060
si:ch73-21g5.7
-0.020
LOC101883766
0.060
apex1
-0.020