Daniocell
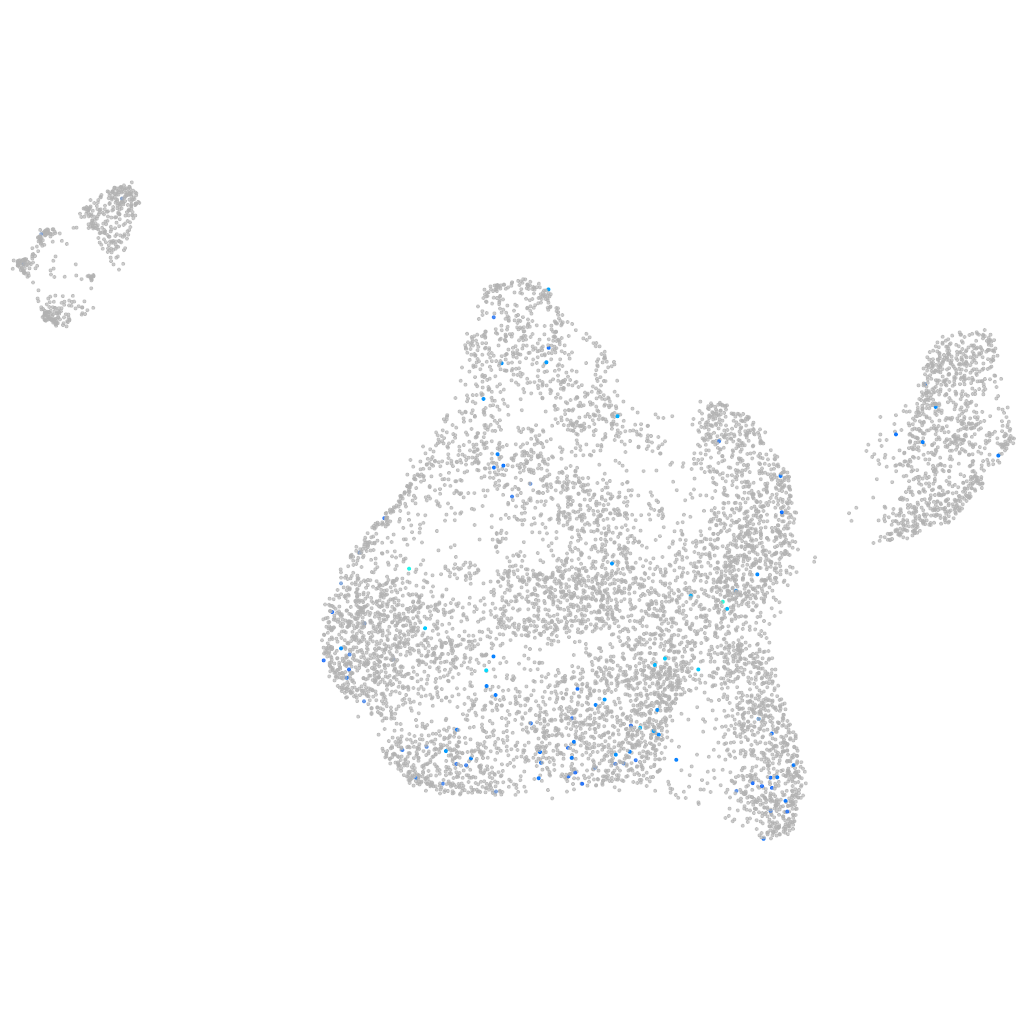
epb41l3a (blastomeres)
erythrocyte membrane protein band 4.1-like 3a
ZFIN
Gene expression UMAP
Display:
Expression
Stage
Other cell groups
all cells
blastomeres
PGCs
endoderm
axial mesoderm
muscle
mural cells /
non-skeletal muscle
mesenchyme
hematopoietic /
vasculature
pronephros
neural
spinal cord / glia
eye
taste / olfactory
otic / lateral line
epidermis
periderm
fin
ionocytes / mucous
pigment cells
Expression by stage/cluster
Correlated gene expression
Positive correlation
Negative correlation
Gene
r
Gene
r
CABZ01078767.1
0.211
bzw1b
-0.046
CU695117.1
0.150
sec61b
-0.036
prf1.6
0.142
BX005461.1
-0.033
nkx2.3
0.132
zgc:56699
-0.033
mir429b
0.127
prkar2aa
-0.033
si:ch1073-90m23.1
0.125
kif23
-0.033
mrc1b
0.125
dhrs13a.2
-0.031
LO017656.1
0.124
glulb
-0.031
LOC108190098
0.123
pabpn1l
-0.030
cdhr5b
0.118
znf207a
-0.030
aqp10a
0.117
gtf3c5
-0.030
XLOC-020031
0.115
sdc4
-0.030
BX511246.1
0.111
dctpp1
-0.030
flrt1b
0.105
blf
-0.029
CR376741.1
0.103
me3
-0.029
dio3a
0.102
zgc:103482
-0.029
CCNB1IP1
0.101
si:rp71-19m20.1
-0.029
nxph2b
0.100
slc37a2
-0.029
tbx22
0.095
aco2
-0.029
LOC103909463
0.094
zgc:101016
-0.029
ackr4a
0.092
ppp1r2
-0.028
sh3gl2b
0.092
STMP1
-0.028
si:cabz01033205.3
0.092
zgc:161969
-0.028
LOC110437930
0.090
mnat1
-0.028
si:ch73-309g22.1
0.088
CU694197.1
-0.028
LOC110438130
0.085
ldhba
-0.028
scpp7
0.084
taf13
-0.027
si:dkeyp-68b7.12
0.082
mbpb
-0.027
ada2b
0.082
ints14
-0.027
ftr79
0.081
tia1
-0.027
lrp1aa
0.081
foxn2b
-0.027
mhc1uma
0.079
mrps18a
-0.027
AL935183.1
0.078
anapc10
-0.027
hoxc10a
0.078
gtf2e2
-0.026
hsd17b3
0.078
wdr46
-0.026