Daniocell
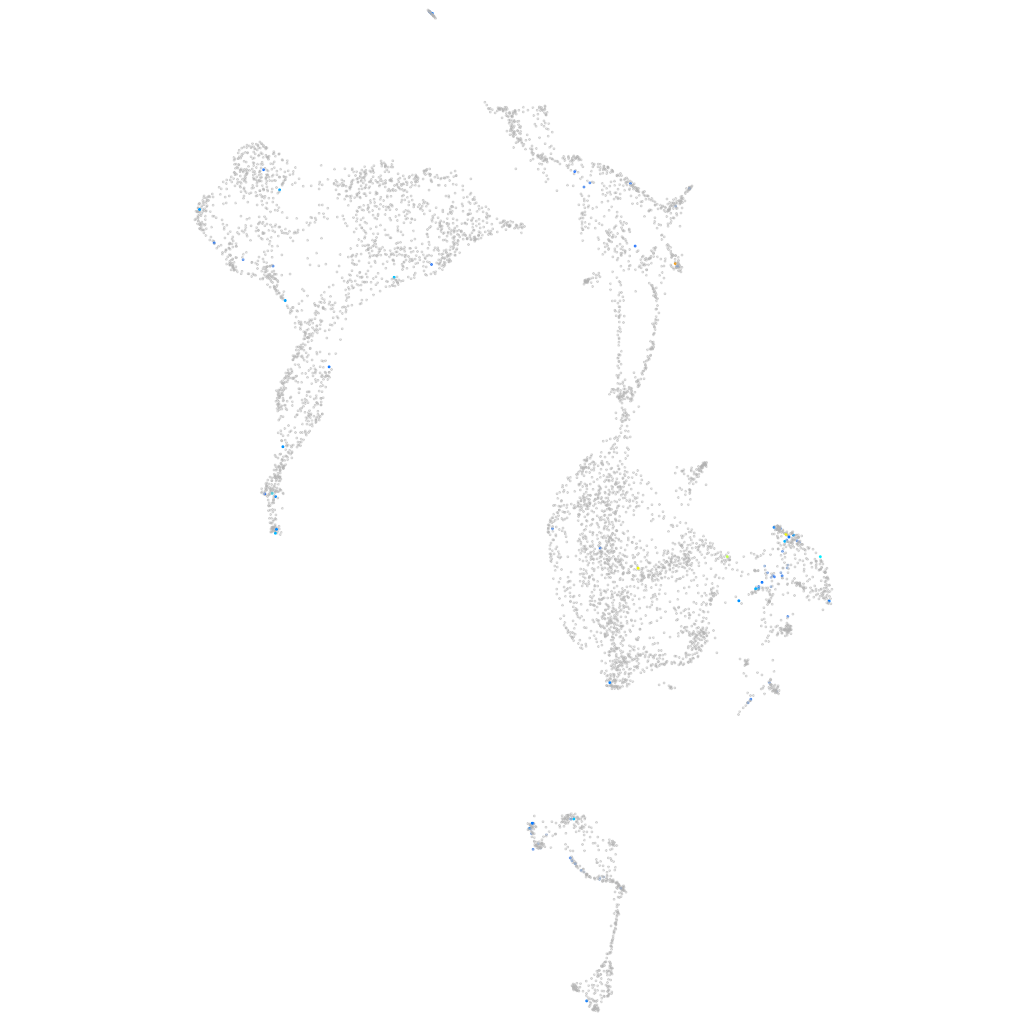
epb41l3a (axial mesoderm)
erythrocyte membrane protein band 4.1-like 3a
ZFIN
Gene expression UMAP
Display:
Expression
Stage
Other cell groups
all cells
blastomeres
PGCs
endoderm
axial mesoderm
muscle
mural cells /
non-skeletal muscle
mesenchyme
hematopoietic /
vasculature
pronephros
neural
spinal cord / glia
eye
taste / olfactory
otic / lateral line
epidermis
periderm
fin
ionocytes / mucous
pigment cells
Expression by stage/cluster
Correlated gene expression
Positive correlation
Negative correlation
Gene
r
Gene
r
si:dkey-30j16.3
0.273
ctnnb1
-0.055
map3k8
0.242
tbxta
-0.051
onecut3b
0.207
qkia
-0.051
XLOC-005615
0.194
wwp2
-0.041
TMEM196 (1 of many)
0.191
msna
-0.040
wdr93
0.189
ing5b
-0.039
si:ch211-168d23.3
0.176
crtap
-0.039
FP016018.3
0.169
zgc:92818
-0.038
LOC103910480
0.169
tmem254
-0.038
spata18
0.168
ctsla
-0.037
MSANTD2
0.168
taf13
-0.037
LOC103909742
0.167
loxl3b
-0.036
zgc:171759
0.163
rps18
-0.036
CU138542.1
0.159
sp5l
-0.035
si:dkey-82o10.4
0.159
anp32b
-0.035
LOC103908636
0.158
noto
-0.035
irx2a
0.156
pkp3a
-0.034
dab1b
0.148
gas2b
-0.034
LOC108182242
0.147
sncga
-0.034
oxt
0.143
dpm3
-0.034
plcxd3
0.143
smc2
-0.034
LOC110438247
0.141
p4ha2
-0.034
CU207354.2
0.140
yap1
-0.033
LOC108190371
0.139
cd2ap
-0.033
BX296526.2
0.139
atp1b3b
-0.033
rpz3
0.137
bzw1b
-0.033
zgc:77784
0.133
tpx2
-0.033
si:ch211-214c20.1
0.133
plp2
-0.033
lrit1a
0.131
ror2
-0.033
XLOC-018367
0.130
cenps
-0.033
LOC101885174
0.128
serpinh1b
-0.033
CR387996.1
0.128
chaf1a
-0.032
kcnh7
0.128
irf2a
-0.032
arhgap39
0.123
zmat2
-0.032
si:ch73-366i20.1
0.123
sec13
-0.032