Daniocell
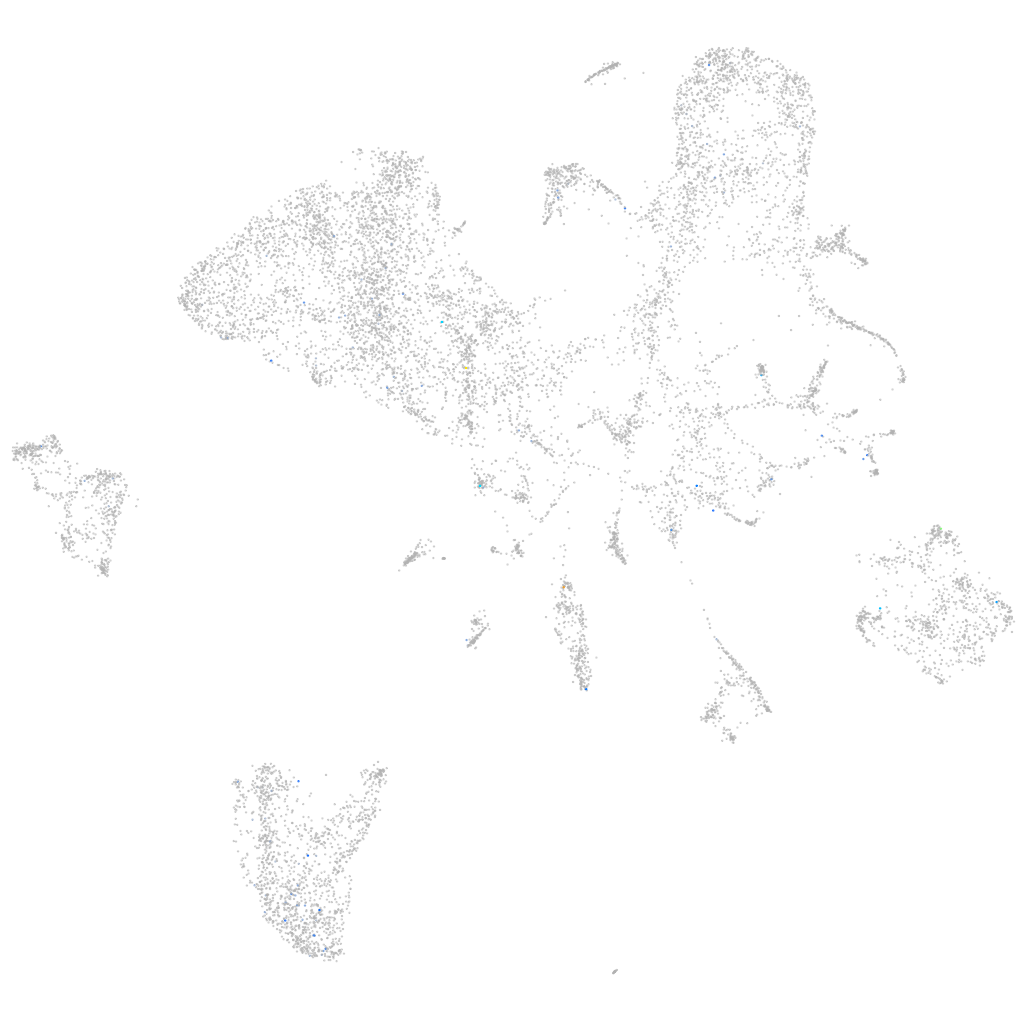
epb41l3a (endoderm)
erythrocyte membrane protein band 4.1-like 3a
ZFIN
Gene expression UMAP
Display:
Expression
Stage
Other cell groups
all cells
blastomeres
PGCs
endoderm
axial mesoderm
muscle
mural cells /
non-skeletal muscle
mesenchyme
hematopoietic /
vasculature
pronephros
neural
spinal cord / glia
eye
taste / olfactory
otic / lateral line
epidermis
periderm
fin
ionocytes / mucous
pigment cells
Expression by stage/cluster
Correlated gene expression
Positive correlation
Negative correlation
Gene
r
Gene
r
BX511025.1
0.308
si:dkey-151g10.6
-0.053
si:ch211-140l13.3
0.288
rpl14
-0.052
LOC100538123
0.269
rpl35a
-0.047
BX890600.1
0.267
rps27a
-0.044
hsp70.1
0.252
rplp2
-0.041
si:ch211-199o1.2
0.248
rpl24
-0.041
znf648
0.242
rps21
-0.039
LO018437.1
0.239
rplp2l
-0.039
hsp70.2
0.237
rpl23
-0.038
gabra6b
0.231
rps24
-0.037
si:ch1073-450f2.1
0.223
rpl13a
-0.037
si:dkey-4p15.3
0.222
rpl10a
-0.037
ifitm5
0.213
uba52
-0.036
pfkfb2a
0.213
rack1
-0.035
CU855758.2
0.212
rps3a
-0.034
CU462913.1
0.211
rpl17
-0.034
snx8b
0.204
rps8a
-0.034
si:dkey-264b2.3
0.196
rps14
-0.034
ric8a
0.194
gstp1
-0.034
rusc1
0.181
eef1da
-0.034
si:dkey-32e6.3
0.175
rps2
-0.034
mlf1
0.174
rps26l
-0.033
C12orf75
0.174
faua
-0.033
eef1a1b
0.173
cebpb
-0.033
hsp70l
0.167
rps29
-0.033
col19a1
0.162
rpl28
-0.032
si:ch211-232d10.1
0.160
itm2ba
-0.032
c16h2orf66
0.160
rps12
-0.031
hsp70.3
0.156
gsta.1
-0.031
grm4
0.154
prdx2
-0.031
CR792424.1
0.152
rpl23a
-0.031
ssh1b
0.152
rpl36
-0.031
CABZ01008739.1
0.149
rps15
-0.031
si:ch211-195b13.1
0.149
rps11
-0.030
LOC103912072
0.146
rgrb
-0.030