Daniocell
enpp2 (epidermis)
ectonucleotide pyrophosphatase/phosphodiesterase 2
ZFIN
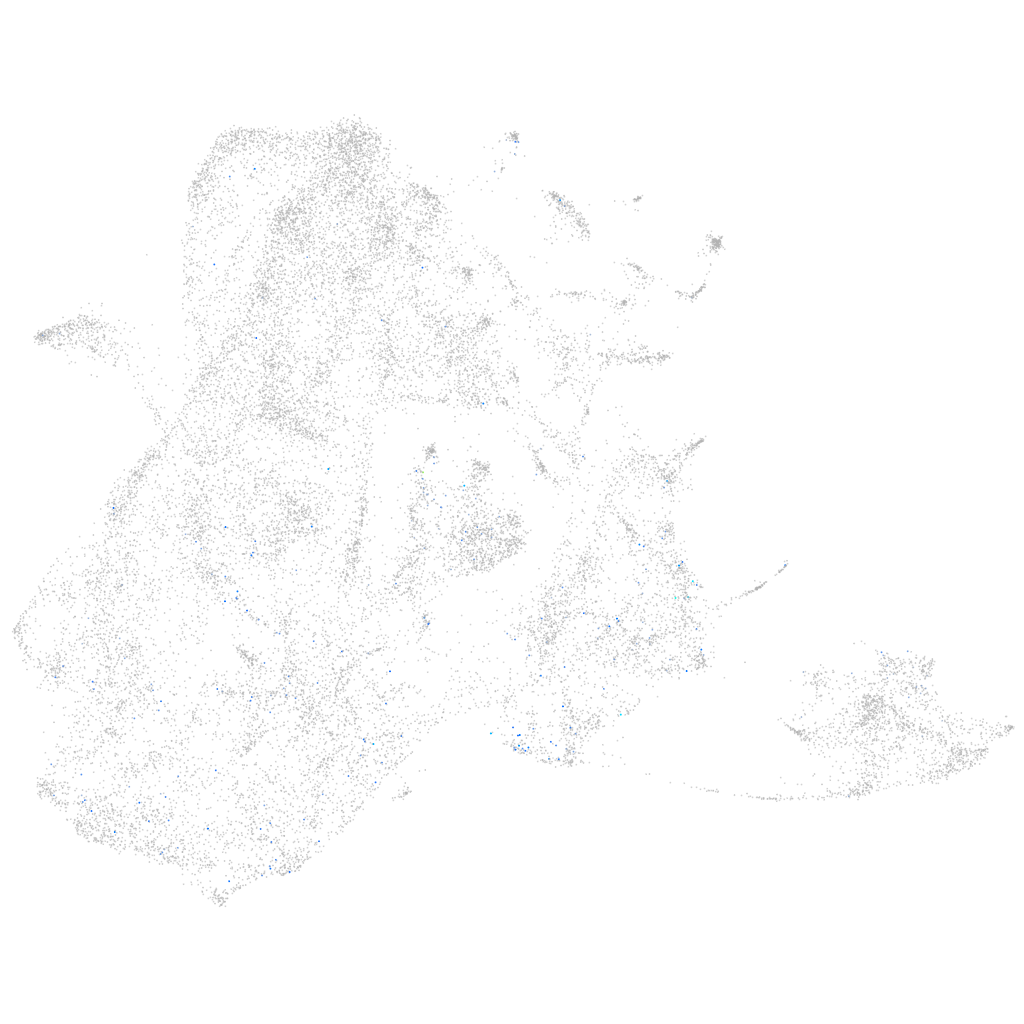
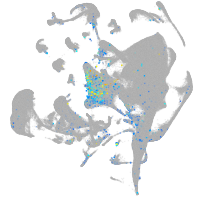
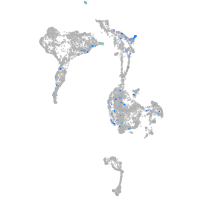
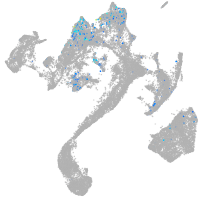
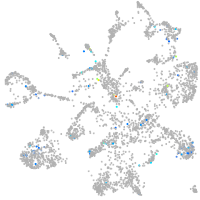
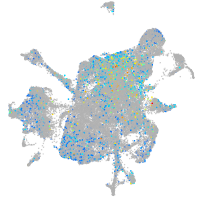
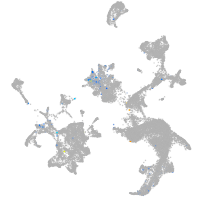
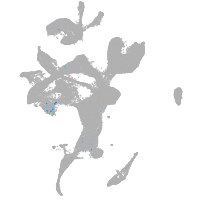
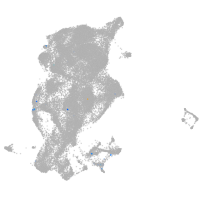
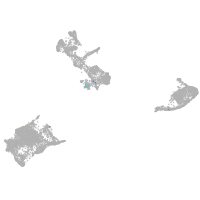
Gene expression UMAP
Display:
Expression
Stage
Other cell groups
all cells
blastomeres
PGCs
endoderm
axial mesoderm
muscle
mural cells /
non-skeletal muscle
mesenchyme
hematopoietic /
vasculature
pronephros
neural
spinal cord / glia
eye
taste / olfactory
otic / lateral line
epidermis
periderm
fin
ionocytes / mucous
pigment cells
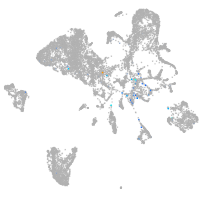
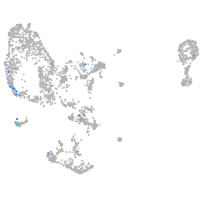
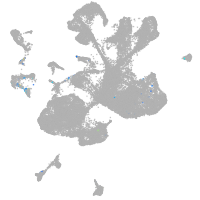
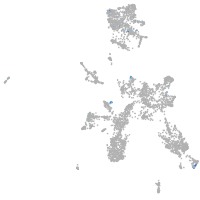
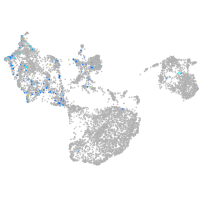
Expression by stage/cluster
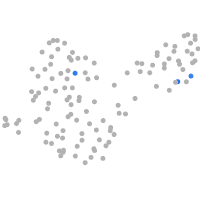
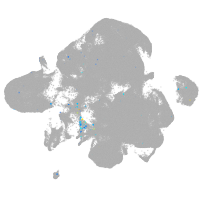
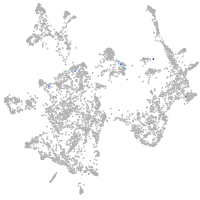
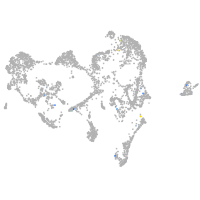
Correlated gene expression
Positive correlation
Negative correlation
Gene
r
Gene
r
CU062628.1
0.174
krtt1c19e
-0.054
CR352226.4
0.151
krt5
-0.049
si:dkey-26i13.8
0.134
rbp4
-0.046
LO018422.1
0.130
cyt1
-0.045
spon2b
0.109
aep1
-0.043
twist2
0.098
si:dkey-33c14.3
-0.043
LOC103910313
0.094
wu:fb18f06
-0.043
gsc
0.093
wu:fa03e10
-0.041
foxl1
0.092
krt4
-0.041
CU856344.2
0.088
col1a1b
-0.040
or131-2
0.088
zgc:136930
-0.039
LOC110439812
0.086
col1a1a
-0.038
si:ch211-106h4.12
0.083
krt91
-0.038
si:dkey-98j1.5
0.081
col14a1b
-0.038
LOC103908612
0.081
col1a2
-0.037
eme2
0.080
lgals1l1
-0.037
cd81a
0.080
s100a10b
-0.037
si:dkey-261h17.1
0.079
si:dkey-183i3.5
-0.035
si:dkey-217m5.8
0.079
cyt1l
-0.035
LOC110438157
0.076
itgb1b.2
-0.035
krt18a.1
0.076
itgb4
-0.035
zgc:162612
0.076
DSG2
-0.034
CR457444.3
0.075
col11a1a
-0.034
dpt
0.075
postnb
-0.034
tm4sf5
0.074
col2a1b
-0.033
LOC103911081
0.073
col17a1a
-0.033
dkk3b
0.072
rplp2
-0.033
nid2a
0.072
anxa1a
-0.033
esamb
0.069
si:dkey-16p21.8
-0.032
BX465186.2
0.069
zgc:85932
-0.032
lsp1
0.068
smdt1a
-0.032
pitx2
0.068
eef1da
-0.031
plpp3
0.067
zgc:86896
-0.031
pltp
0.067
gapdhs
-0.031
si:ch211-152c2.3
0.067
ptgdsb.1
-0.030