Daniocell
ctc1 (blastomeres)
CTS telomere maintenance complex component 1
ZFIN
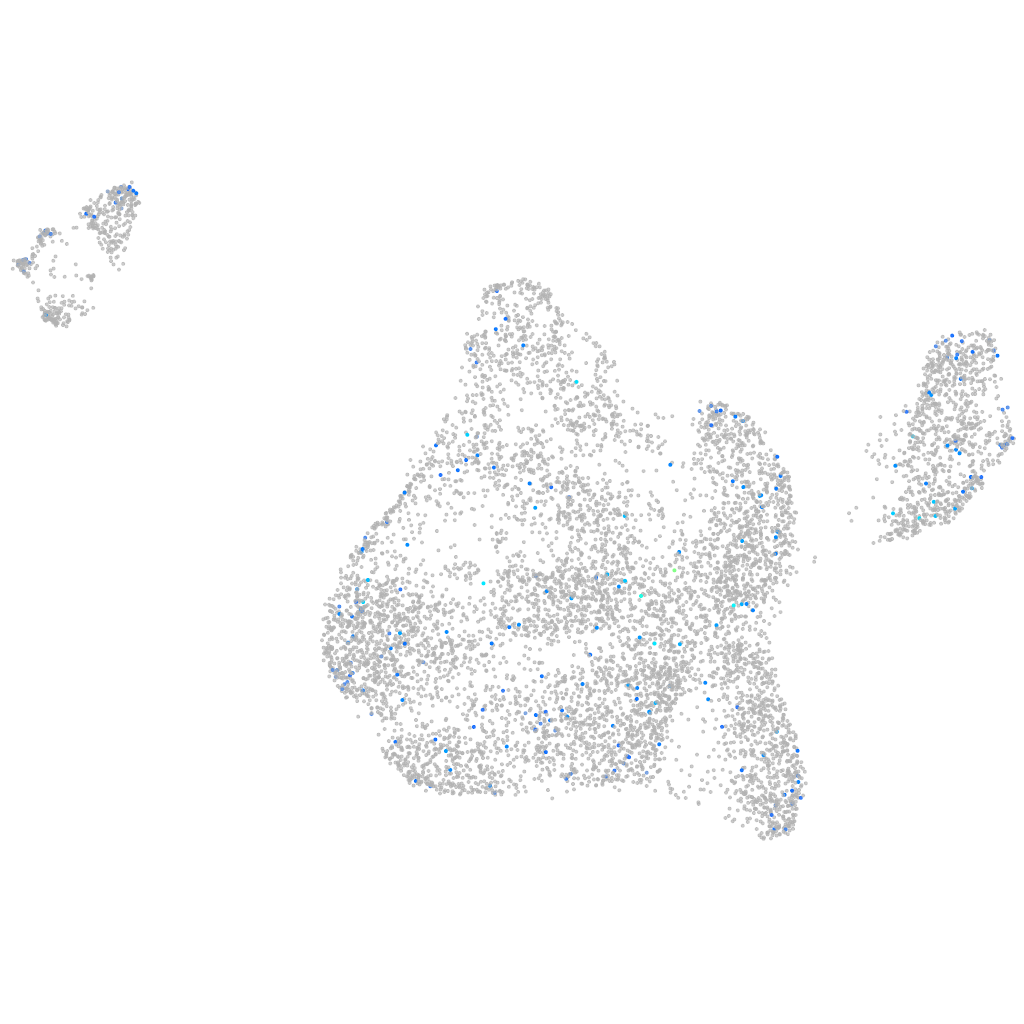
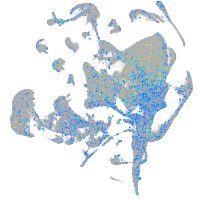
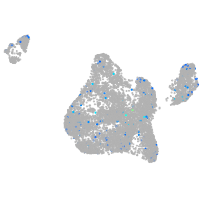
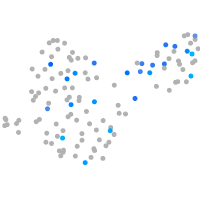
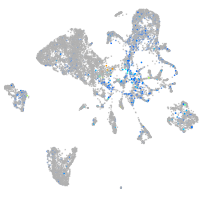
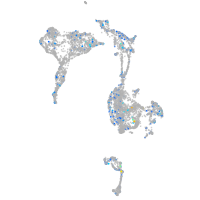
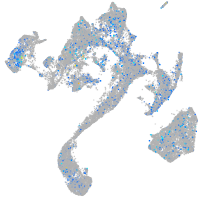
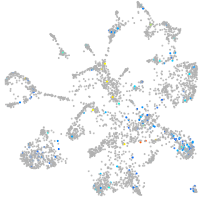
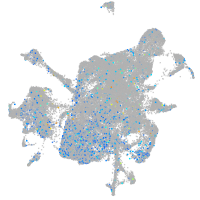
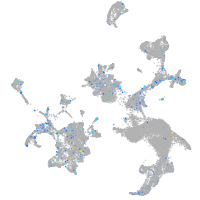
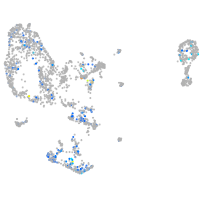
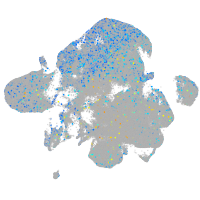
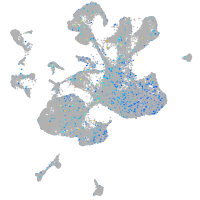
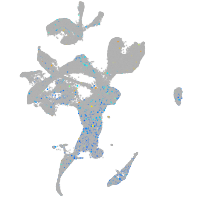
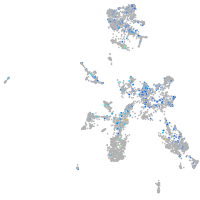
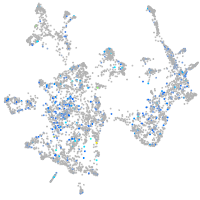
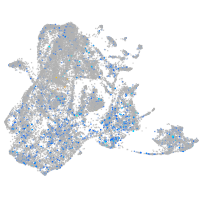
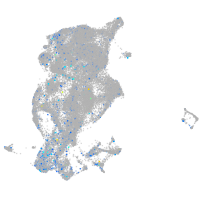
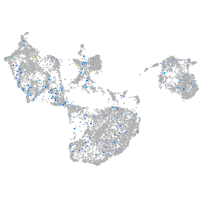
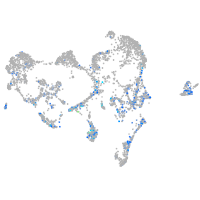
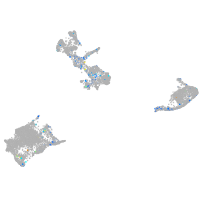
Gene expression UMAP
Display:
Expression
Stage
Other cell groups
all cells
blastomeres
PGCs
endoderm
axial mesoderm
muscle
mural cells /
non-skeletal muscle
mesenchyme
hematopoietic /
vasculature
pronephros
neural
spinal cord / glia
eye
taste / olfactory
otic / lateral line
epidermis
periderm
fin
ionocytes / mucous
pigment cells
Expression by stage/cluster
Correlated gene expression
Positive correlation
Negative correlation
Gene
r
Gene
r
hoxa10b
0.151
NC-002333.4
-0.035
si:dkeyp-4c4.2
0.113
si:ch211-266d19.4
-0.031
BX908744.2
0.112
hsp90ab1
-0.031
XLOC-019030
0.112
rdh10a
-0.029
BX088712.1
0.110
ponzr1
-0.026
LOC110439514
0.107
clgn
-0.026
smtla
0.101
tdg.2
-0.026
zgc:172271
0.099
cox6c
-0.026
LOC108191791
0.095
eef1a1l1
-0.026
LOC100536104
0.094
si:ch211-113a14.18
-0.025
obscna
0.091
LOC108179143
-0.025
wnt9b
0.090
si:ch211-214c7.4
-0.025
si:dkey-61p9.6
0.088
psma5
-0.024
tuft1a
0.087
jam3b
-0.024
gja8b
0.086
atg3
-0.023
rpe65c
0.086
papss1
-0.023
galr2a
0.085
pitx2
-0.023
trim69
0.083
mntb
-0.023
XLOC-002539
0.083
rfc3
-0.023
BX548046.2
0.079
BX957362.1
-0.022
CR762475.1
0.079
cct5
-0.022
chrnb2a
0.079
fam13a
-0.022
BX470247.1
0.079
TMEM19
-0.022
FP102309.1
0.078
rangap1a
-0.022
scn3b
0.078
LOC100008030
-0.022
AL954695.3
0.077
crip1
-0.022
LOC100334104
0.077
ets2
-0.022
myhz2
0.077
CT027611.1
-0.021
si:ch73-306e8.2
0.077
trappc1
-0.021
tor4ab
0.076
thap1
-0.021
aqp9b
0.076
dock1
-0.021
si:ch211-207l14.1
0.076
CABZ01113599.1
-0.021
AL954149.1
0.075
iqcc
-0.021
CACNA2D1
0.075
BX001030.2
-0.021
CABZ01040998.1
0.074
ccdc85b
-0.021