Daniocell
coq2 (blastomeres)
coenzyme Q2 4-hydroxybenzoate polyprenyltransferase
ZFIN
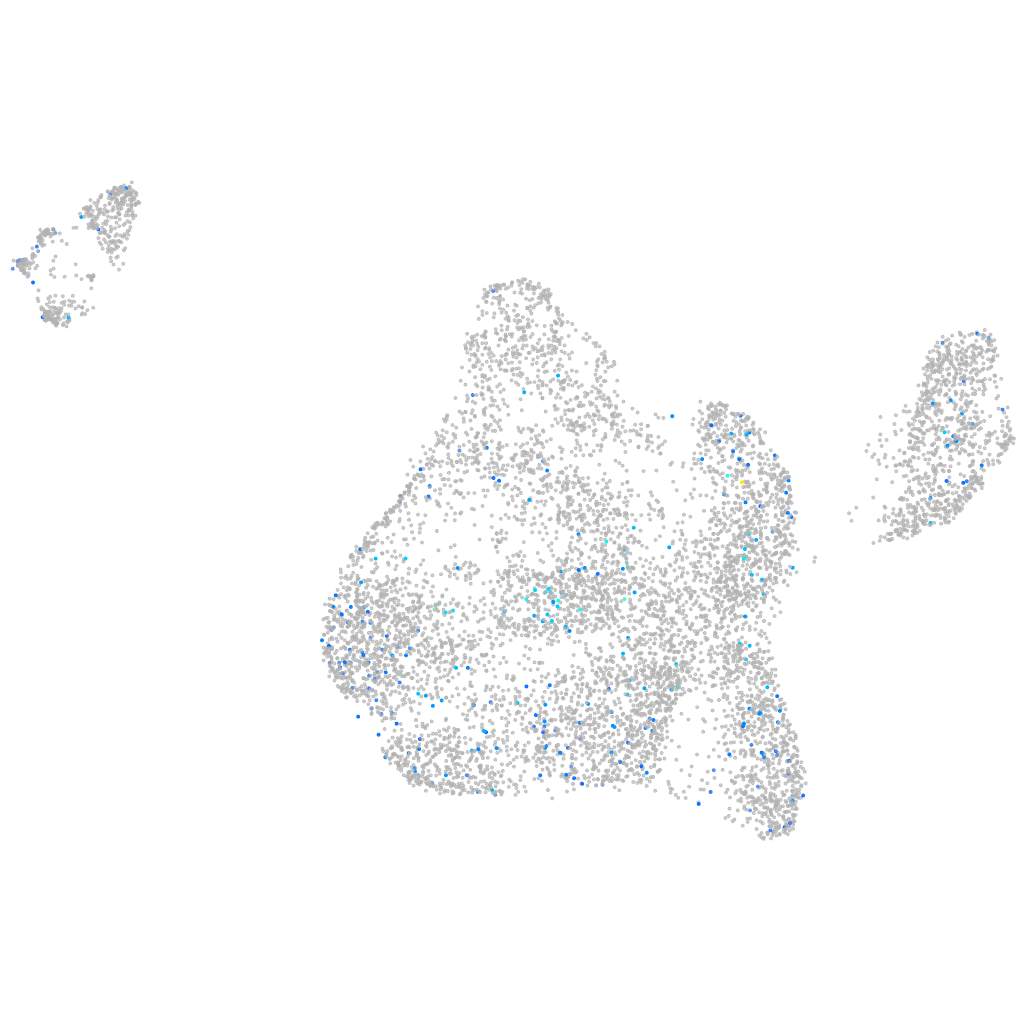
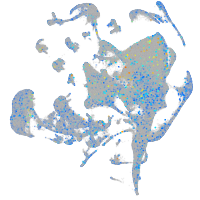
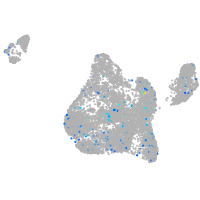
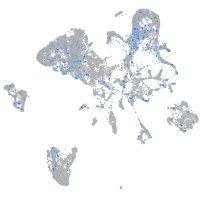
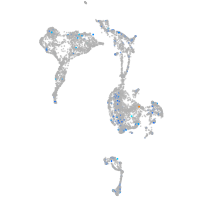
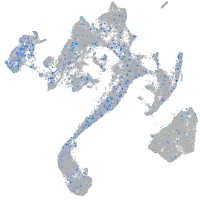
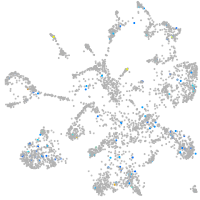
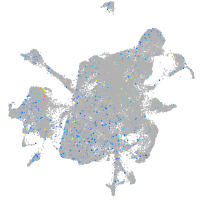
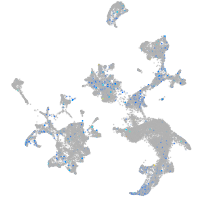
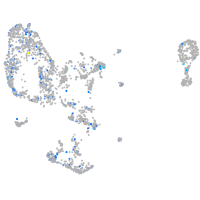
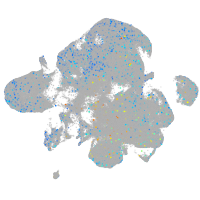
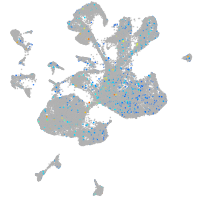
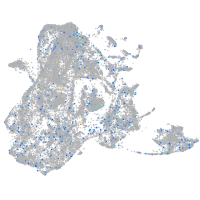
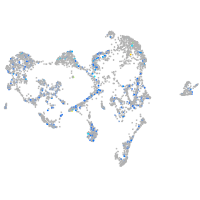
Gene expression UMAP
Display:
Expression
Stage
Other cell groups
all cells
blastomeres
PGCs
endoderm
axial mesoderm
muscle
mural cells /
non-skeletal muscle
mesenchyme
hematopoietic /
vasculature
pronephros
neural
spinal cord / glia
eye
taste / olfactory
otic / lateral line
epidermis
periderm
fin
ionocytes / mucous
pigment cells
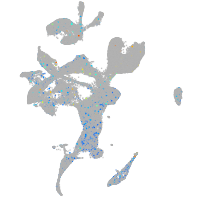
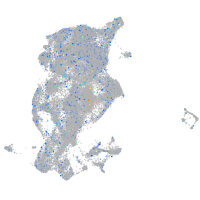
Expression by stage/cluster
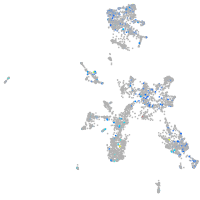
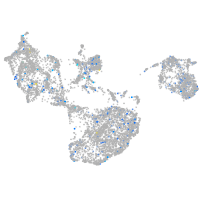
Correlated gene expression
Positive correlation
Negative correlation
Gene
r
Gene
r
kcnt1
0.110
tbx16
-0.049
LOC103912010
0.103
wnt11f2
-0.046
LOC101883850
0.100
ddx4
-0.045
GUCY1A2
0.097
tbxta
-0.044
mc5ra
0.097
fscn1a
-0.043
LOC108183378
0.093
cyp27c1
-0.039
si:ch211-271g18.1
0.093
lhx1a
-0.038
plxdc1
0.090
LOC100008030
-0.037
tomt
0.088
acvr1ba
-0.036
LOC100331404
0.087
foxa
-0.036
itih1
0.084
BX927327.1
-0.035
XLOC-038929
0.084
gle1
-0.035
si:ch211-64i20.3
0.081
map7d1a
-0.035
hgfa
0.076
atf6
-0.034
slco2b1
0.076
ddit4
-0.034
LOC101884552
0.074
lamp2
-0.033
LOC108192008
0.074
cnot9
-0.033
camk2d2
0.072
chac1
-0.033
CABZ01081897.1
0.072
hes6
-0.033
znf1145
0.071
baz1b
-0.033
itprid1
0.069
ptdss1a
-0.032
si:dkey-238j22.1
0.069
thoc7
-0.032
FO082780.1
0.067
pitx2
-0.032
si:ch211-38m6.6
0.067
cdc42bpb
-0.032
myo1ea
0.066
si:dkey-261j4.3
-0.032
CABZ01084564.1
0.066
osr1
-0.031
p2ry12
0.065
arid2
-0.031
grm3
0.064
higd1a
-0.031
lrrfip1b
0.064
rcor1
-0.030
LOC108190613
0.064
zcchc2
-0.030
XLOC-014924
0.063
sebox
-0.030
BX784023.1
0.062
tpbga
-0.030
omd
0.062
h2af1al
-0.030
LOC100536983
0.061
stox2b
-0.030
slc38a8a
0.061
dkk1b
-0.030