Daniocell
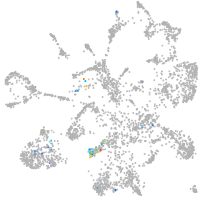
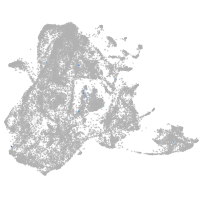
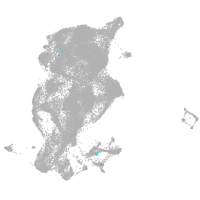
cilp2 (pronephros)
cartilage intermediate layer protein 2
ZFIN
Gene expression UMAP
Display:
Expression
Stage
Other cell groups
all cells
blastomeres
PGCs
endoderm
axial mesoderm
muscle
mural cells /
non-skeletal muscle
mesenchyme
hematopoietic /
vasculature
pronephros
neural
spinal cord / glia
eye
taste / olfactory
otic / lateral line
epidermis
periderm
fin
ionocytes / mucous
pigment cells
Expression by stage/cluster
Correlated gene expression
Positive correlation
Negative correlation
Gene
r
Gene
r
LOC100334508
0.747
CR383676.1
-0.049
LOC101883036
0.569
si:ch211-222l21.1
-0.047
LOC110438380
0.521
rpl4
-0.039
slc4a11
0.521
sub1a
-0.039
LOC110439264
0.514
hmga1a
-0.037
si:ch211-283l16.1
0.470
khdrbs1a
-0.036
ucmaa
0.462
ywhaba
-0.035
klhl6
0.454
ammecr1
-0.034
kiss1
0.429
polr2d
-0.032
myoz2b
0.411
psma6a
-0.032
si:ch73-29c22.1
0.411
fth1a
-0.032
si:dkey-38l22.2
0.411
phf5a
-0.032
ahrra
0.411
hmgn2
-0.032
CR385041.1
0.411
rpl6
-0.032
CU466278.1
0.411
nucks1a
-0.032
klhl40b
0.411
hmgb2a
-0.031
si:ch211-89o9.4
0.411
CU694197.1
-0.031
tacr1a
0.411
rgcc
-0.031
twf2a
0.411
col18a1a
-0.030
kbtbd13
0.411
snrpb
-0.030
LOC101882356
0.411
ncbp2
-0.030
smyhc3
0.411
si:ch73-1a9.3
-0.030
myoz2a
0.380
coa3a
-0.030
peak3
0.364
eif3ha
-0.029
LOC110438004
0.358
mrpl24
-0.029
CU633479.2
0.355
nop56
-0.029
cacna1sa
0.349
zgc:153867
-0.028
evpll
0.348
NC-002333.4
-0.028
si:ch211-225b10.3
0.339
matr3l1.1
-0.027
mybpc3
0.333
tmem167a
-0.027
si:ch211-151h10.2
0.333
rgs4
-0.027
FO834828.1
0.330
psma5
-0.027
slc25a47a
0.325
ppargc1b
-0.027
si:ch73-380l3.2
0.308
acin1a
-0.027
mylk4a
0.294
faub
-0.027