Daniocell
cilp2 (fin)
cartilage intermediate layer protein 2
ZFIN
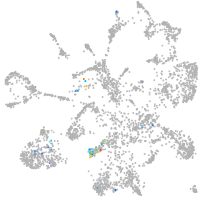
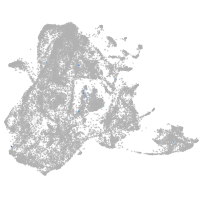
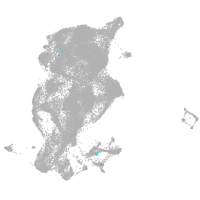
Gene expression UMAP
Display:
Expression
Stage
Other cell groups
all cells
blastomeres
PGCs
endoderm
axial mesoderm
muscle
mural cells /
non-skeletal muscle
mesenchyme
hematopoietic /
vasculature
pronephros
neural
spinal cord / glia
eye
taste / olfactory
otic / lateral line
epidermis
periderm
fin
ionocytes / mucous
pigment cells
Expression by stage/cluster
Correlated gene expression
Positive correlation
Negative correlation
Gene
r
Gene
r
si:ch211-11c3.11
0.557
hdlbpa
-0.026
LOC110438339
0.483
copa
-0.025
FO904898.4
0.411
gstp1
-0.025
sp100.1
0.322
cxcr4a
-0.024
si:ch211-161m3.2
0.286
calm1a
-0.023
ccl39.9
0.283
cycsb
-0.023
dcdc2b
0.263
cdh1
-0.023
kcnv2a
0.253
colgalt2
-0.023
anks4b
0.251
zgc:86896
-0.022
si:dkey-102c8.2
0.241
COX7A2 (1 of many)
-0.022
olfml2bb
0.240
lamtor5
-0.022
si:busm1-52i16.2
0.238
ptgdsb.1
-0.022
XLOC-032001
0.236
ndufa1
-0.022
esm1
0.233
dusp1
-0.022
tspan34
0.231
dynll1
-0.022
flj13639
0.222
eif5a
-0.022
crygm2d10
0.219
snrpb
-0.022
si:dkey-247i3.5
0.211
txndc5
-0.021
kcnj9
0.203
paplna
-0.021
FO834828.1
0.202
hp1bp3
-0.021
si:ch73-22a13.3
0.201
rtn4a
-0.021
CU929402.1
0.197
gsnb
-0.021
xk
0.195
arhgdia
-0.021
LOC110439302
0.183
cnn2
-0.021
si:dkey-31e10.1
0.183
arhgef5
-0.020
mc5ra
0.182
tp63
-0.020
fscn1b
0.174
mir205
-0.020
RIMS2
0.168
fras1
-0.020
LOC103911555
0.167
rab11fip1b
-0.020
irf4b
0.166
ssr3
-0.020
hhatlb
0.164
ddost
-0.020
plod2
0.163
cbx1a
-0.020
CU459094.1
0.162
capza1b
-0.020
dnajc11b
0.162
hoxa10b
-0.020
XLOC-015238
0.162
irf2bpl
-0.020