Daniocell
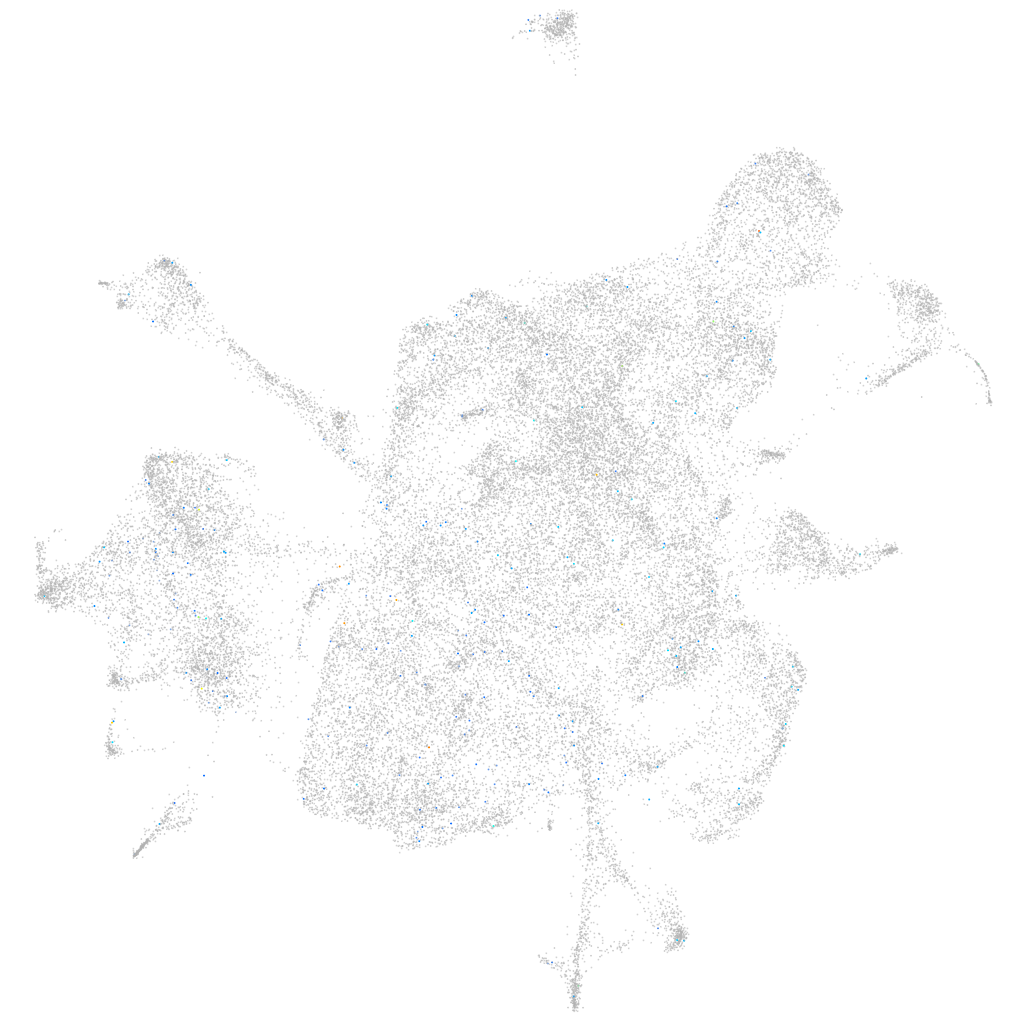
cab39 (mesenchyme)
calcium binding protein 39
ZFIN
Gene expression UMAP
Display:
Expression
Stage
Other cell groups
all cells
blastomeres
PGCs
endoderm
axial mesoderm
muscle
mural cells /
non-skeletal muscle
mesenchyme
hematopoietic /
vasculature
pronephros
neural
spinal cord / glia
eye
taste / olfactory
otic / lateral line
epidermis
periderm
fin
ionocytes / mucous
pigment cells
Expression by stage/cluster
Correlated gene expression
Positive correlation
Negative correlation
Gene
r
Gene
r
LOC101886161
0.105
pvalb1
-0.020
BX072576.3
0.101
rplp2
-0.017
LOC108183743
0.084
htra1a
-0.015
CABZ01067150.1
0.082
myhz1.2
-0.014
pimr88
0.080
lrp1aa
-0.014
jac6
0.075
eef1da
-0.014
NC-002333.2
0.074
pvalb2
-0.014
zgc:112183
0.070
bhmt
-0.013
LOC103911208
0.067
ecm1b
-0.013
BX571884.1
0.066
BX511129.1
-0.012
si:dkey-182i3.11
0.065
gngt2b
-0.012
si:ch211-229g14.3
0.064
col8a2
-0.012
si:dkey-266f7.10
0.064
CYTL1
-0.012
or115-7
0.064
loxl1
-0.012
sinup
0.063
sema3fa
-0.012
si:ch211-155m12.5
0.063
lhx8a
-0.011
AL929237.2
0.062
apoa2
-0.011
BX663606.1
0.059
slc7a10a
-0.011
BX511223.1
0.058
aldob
-0.011
LOC110440125
0.053
CABZ01092746.1
-0.011
opn4xa
0.052
foxf2b
-0.011
tradv5.0.1
0.051
zgc:101566
-0.011
ano8a
0.048
cav2
-0.011
CABZ01057496.1
0.048
hapln1b
-0.011
XLOC-031544
0.047
krt91
-0.011
LOC110438501
0.047
ecrg4a
-0.011
CR589876.1
0.046
si:dkey-6n6.1
-0.011
si:ch73-46n24.1
0.045
hbbe1.1
-0.010
LOC108184031
0.045
lysmd3
-0.010
si:dkey-34o23.3
0.044
LO018188.1
-0.010
tgm5l
0.044
hgd
-0.010
si:ch73-105b23.1
0.044
ppdpfb
-0.010
or106-11
0.044
meox2b
-0.010
XLOC-002688
0.043
tmem45a
-0.010
CU855936.2
0.043
lxn
-0.010