Daniocell
cab39 (glial cells / spinal cord)
calcium binding protein 39
ZFIN
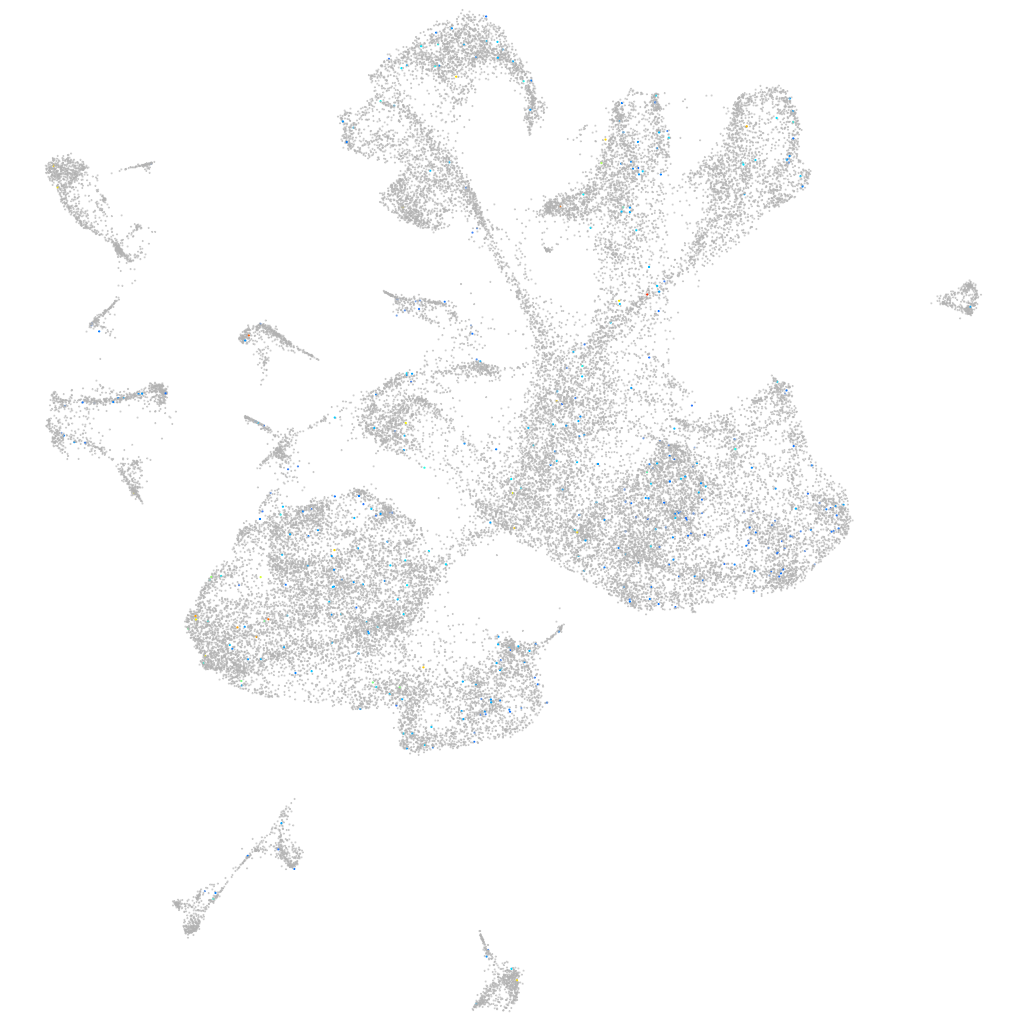
Gene expression UMAP
Display:
Expression
Stage
Other cell groups
all cells
blastomeres
PGCs
endoderm
axial mesoderm
muscle
mural cells /
non-skeletal muscle
mesenchyme
hematopoietic /
vasculature
pronephros
neural
spinal cord / glia
eye
taste / olfactory
otic / lateral line
epidermis
periderm
fin
ionocytes / mucous
pigment cells
Expression by stage/cluster
Correlated gene expression
Positive correlation
Negative correlation
Gene
r
Gene
r
st3gal1l2
0.137
tuba8l3
-0.015
CU571091.1
0.089
dab2ipb
-0.014
nfatc2b
0.076
rps21
-0.013
LOC101882151
0.072
march8
-0.013
BX927363.1
0.069
apoa1b
-0.012
or125-4
0.059
si:dkey-51a16.9
-0.012
zmp:0000000608
0.055
rplp2
-0.012
zgc:195212
0.055
polr2f
-0.012
c1qa
0.055
ndufaf2
-0.012
LOC103910909
0.054
CELA1 (1 of many)
-0.012
LOC110440031
0.053
ncbp2
-0.012
BX005156.1
0.051
pnkp
-0.012
mhc2dbb
0.050
tmem125b
-0.011
CR450824.1
0.050
lims1
-0.011
LOC100333290
0.050
col4a1
-0.011
pimr109
0.048
elovl1b
-0.011
LOC100334422
0.047
tpgs2
-0.011
si:ch211-66i15.5
0.046
si:ch211-244c8.4
-0.011
myadml2
0.044
trib2
-0.011
CR759826.1
0.044
rps13
-0.011
LOC103911776.1
0.044
myo9aa
-0.011
thsd7bb
0.043
ndufa12
-0.011
igfn1.4
0.043
TRIM67
-0.011
CABZ01052570.1
0.043
ggctb
-0.011
CT573003.1
0.043
fndc3bb
-0.011
CR855860.2
0.042
polr2j
-0.011
clcnk
0.042
cdk5rap1
-0.011
LOC101885457
0.042
pax8
-0.011
jac1
0.042
rbm24a
-0.011
si:dkey-175m17.6
0.041
lgals2b
-0.011
CU914487.1
0.041
znf703
-0.011
LOC101882334
0.040
ercc1
-0.011
LOC110437880
0.040
esrrga
-0.011
zgc:112416
0.039
map4k6
-0.011
slc12a10.2
0.039
zfand6
-0.011