Daniocell
cab39 (fin)
calcium binding protein 39
ZFIN
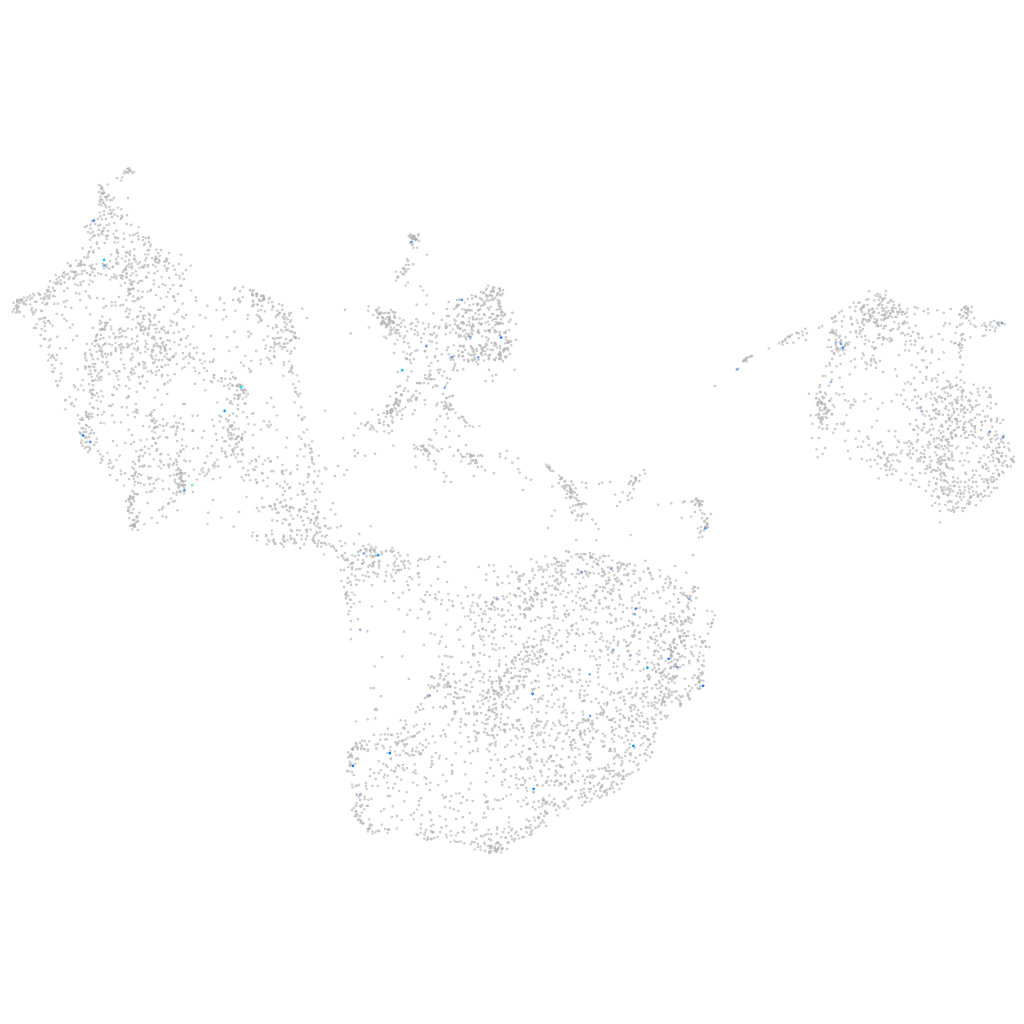
Gene expression UMAP
Display:
Expression
Stage
Other cell groups
all cells
blastomeres
PGCs
endoderm
axial mesoderm
muscle
mural cells /
non-skeletal muscle
mesenchyme
hematopoietic /
vasculature
pronephros
neural
spinal cord / glia
eye
taste / olfactory
otic / lateral line
epidermis
periderm
fin
ionocytes / mucous
pigment cells
Expression by stage/cluster
Correlated gene expression
Positive correlation
Negative correlation
Gene
r
Gene
r
XLOC-020170
0.240
sema3e
-0.035
XLOC-038909
0.236
hbbe1.2
-0.027
tgm8
0.208
usp14
-0.027
XLOC-029061
0.193
prps1a
-0.023
si:ch73-40a17.3
0.184
llph
-0.023
TM4SF19
0.184
fdps
-0.023
LOC107195253
0.181
ms4a17a.7
-0.023
LOC101883645
0.180
asah1b
-0.022
l3mbtl4
0.170
hikeshi
-0.022
RF00133
0.156
cstf1
-0.022
chrna4a
0.154
fam20b
-0.022
BX323067.1
0.145
cdca7a
-0.022
poln
0.141
hbbe2
-0.022
si:dkey-108k21.28
0.128
spint2
-0.022
NC-002333.8
0.128
tes
-0.021
stra6l
0.122
fbxl6
-0.021
zgc:158423
0.119
zgc:123258
-0.021
XLOC-043174
0.117
tfpia
-0.021
foxo1b
0.116
kank3
-0.021
LOC103910799
0.113
hoxc13b
-0.021
BX539307.3
0.109
nfkbiaa
-0.021
CR392012.2
0.107
nelfb
-0.021
LOC101885772
0.107
ccdc59
-0.020
MARCH4 (1 of many)
0.104
serbp1b
-0.020
XLOC-015374
0.103
ogna
-0.020
si:ch211-155m12.1
0.103
fgf8a
-0.020
nkx6.2
0.102
nrp2a
-0.020
LOC101884655
0.101
anxa11b
-0.020
LOC110439495
0.101
hbae3
-0.020
sash3
0.100
tmem206
-0.020
CR457447.1
0.100
ptrh2
-0.020
wu:fb59d01
0.100
fam169ab
-0.020
XLOC-034394
0.098
si:ch1073-392o20.2
-0.020
XLOC-042263
0.097
os9
-0.020
trpa1a
0.095
fermt2
-0.020