
"bone morphogenetic protein receptor, type IAb"
ZFIN 
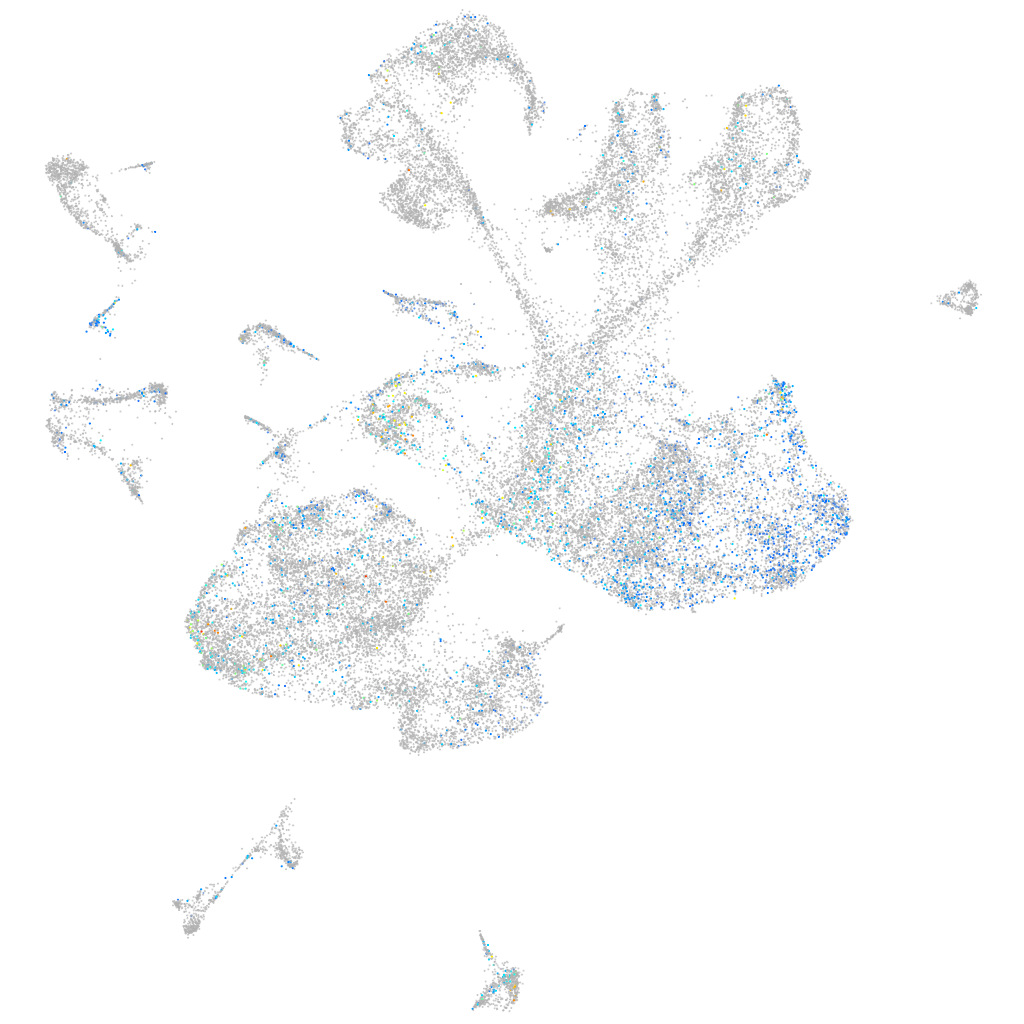
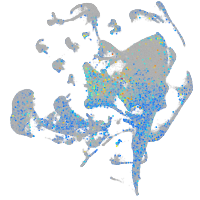
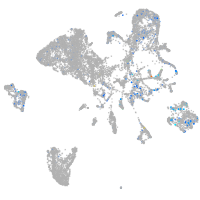
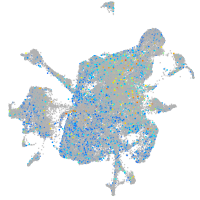
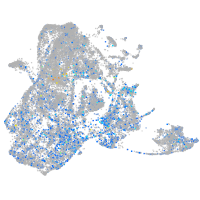
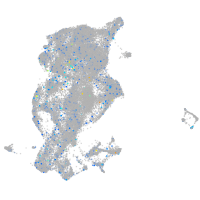
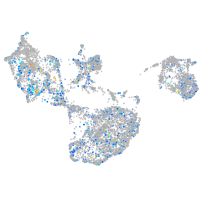
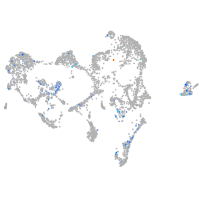
Gene expression UMAP


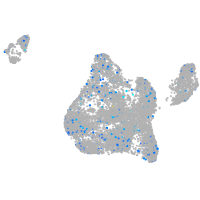
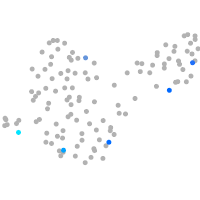
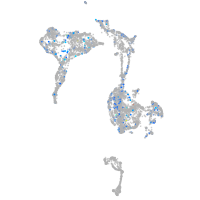
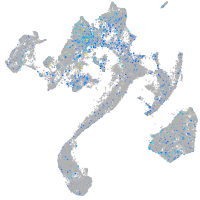
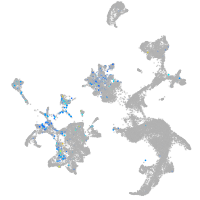
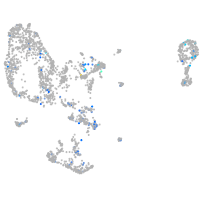
Expression by stage/cluster
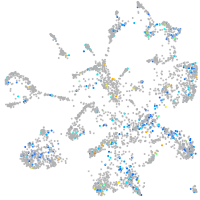
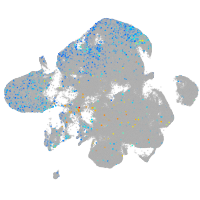
Correlated gene expression
| Positive correlation | Negative correlation | ||
| Gene | r | Gene | r |
| zic2b | 0.110 | tmsb | -0.087 |
| id1 | 0.109 | elavl3 | -0.085 |
| msx1b | 0.102 | tmsb4x | -0.081 |
| gdf10a | 0.098 | myt1b | -0.072 |
| cdh6 | 0.095 | stmn1b | -0.069 |
| col4a6 | 0.093 | gng2 | -0.068 |
| zfp36l1a | 0.089 | rtn1a | -0.068 |
| pleca | 0.088 | tubb5 | -0.065 |
| col4a5 | 0.088 | gng3 | -0.064 |
| pax3a | 0.087 | marcksl1b | -0.063 |
| olig3 | 0.086 | gpm6ab | -0.063 |
| prss35 | 0.085 | sncb | -0.061 |
| apoc1 | 0.083 | si:dkey-276j7.1 | -0.060 |
| dag1 | 0.083 | stxbp1a | -0.059 |
| gas1a | 0.082 | vamp2 | -0.058 |
| wls | 0.082 | scrt2 | -0.058 |
| krt18a.1 | 0.082 | zc4h2 | -0.057 |
| sema3ga | 0.082 | insm1a | -0.056 |
| zic2a | 0.081 | fabp3 | -0.056 |
| psph | 0.080 | ptmaa | -0.056 |
| cdx4 | 0.079 | atcaya | -0.056 |
| col18a1a | 0.079 | tuba1c | -0.055 |
| si:ch211-251b21.1 | 0.077 | myt1a | -0.055 |
| pdgfaa | 0.077 | onecut1 | -0.055 |
| fzd10 | 0.077 | LOC100537384 | -0.054 |
| zic5 | 0.077 | ywhah | -0.054 |
| atoh8 | 0.076 | dpysl3 | -0.054 |
| msx3 | 0.076 | rtn1b | -0.053 |
| sox2 | 0.076 | stx1b | -0.053 |
| mdka | 0.076 | jagn1a | -0.052 |
| fosab | 0.076 | nhlh2 | -0.052 |
| cldn5a | 0.075 | atp6v0cb | -0.051 |
| endouc | 0.075 | elavl4 | -0.051 |
| si:dkeyp-110a12.4 | 0.075 | hmgb3a | -0.051 |
| ndnf | 0.075 | gap43 | -0.051 |