Daniocell
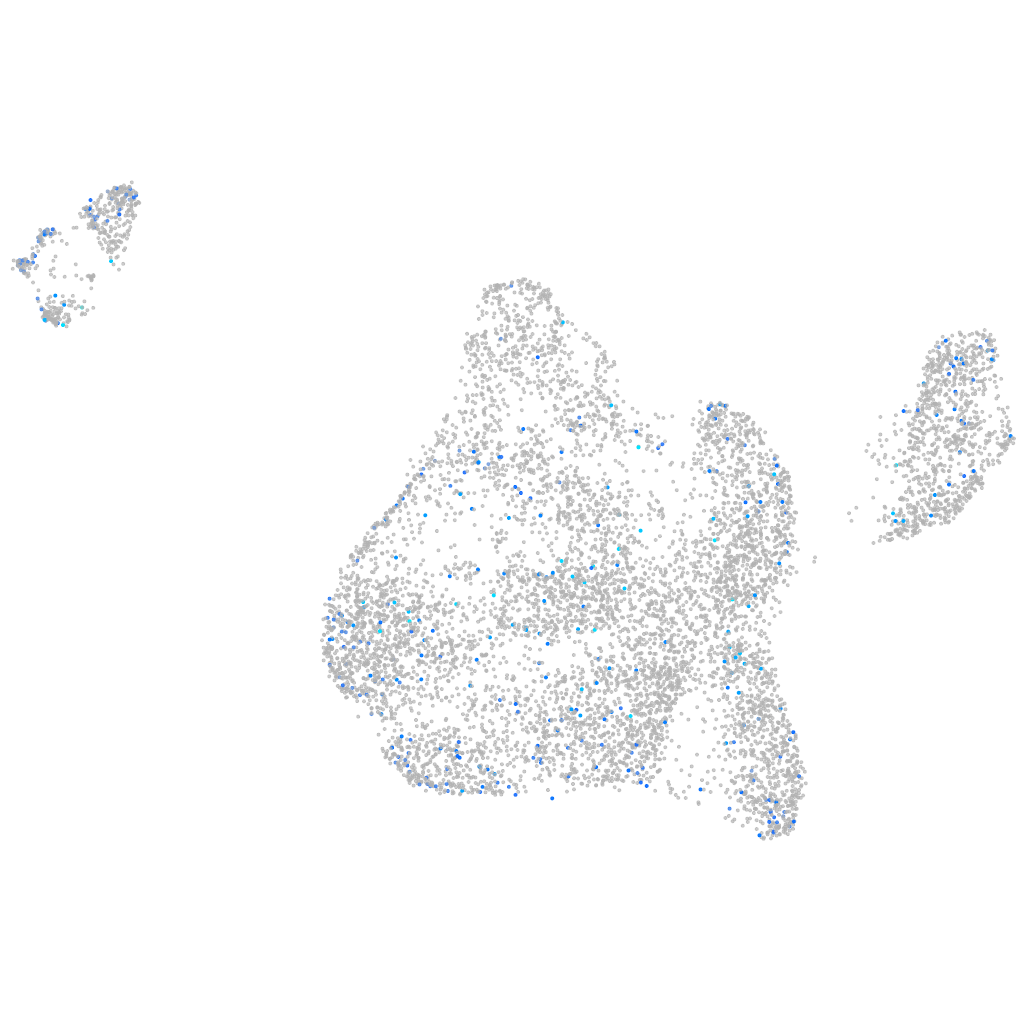
atp6v1ab (blastomeres)
ATPase H+ transporting V1 subunit Ab
ZFIN
Gene expression UMAP
Display:
Expression
Stage
Other cell groups
all cells
blastomeres
PGCs
endoderm
axial mesoderm
muscle
mural cells /
non-skeletal muscle
mesenchyme
hematopoietic /
vasculature
pronephros
neural
spinal cord / glia
eye
taste / olfactory
otic / lateral line
epidermis
periderm
fin
ionocytes / mucous
pigment cells
Expression by stage/cluster
Correlated gene expression
Positive correlation
Negative correlation
Gene
r
Gene
r
LOC100536112
0.105
NC-002333.4
-0.052
LOC110438049
0.099
efnb2a
-0.035
BX950865.1
0.098
efnb2b
-0.033
LOC103910163
0.092
tbx16
-0.032
rab38b
0.092
lhx1a
-0.032
CR749763.1
0.092
wu:fb97g03
-0.032
helq
0.088
osr1
-0.031
LOC101883618
0.086
fscn1a
-0.031
CCR8
0.086
ndufa2
-0.031
CU856344.2
0.086
aplnrb
-0.031
BX908744.2
0.086
msgn1
-0.031
XLOC-019030
0.086
pitx2
-0.030
LOC108191315
0.085
wnt5b
-0.030
FP085414.1
0.084
lrwd1
-0.030
foxg1c
0.082
marcksl1b
-0.030
si:ch211-276a23.5
0.082
si:ch73-1a9.3
-0.030
LOC797394
0.079
hmga1a
-0.030
fam131bb
0.079
ndr1
-0.029
zgc:158785
0.078
zswim5
-0.029
LOC100536104
0.072
si:dkeyp-2e4.3
-0.029
si:zfos-411a11.2
0.071
hmgn6
-0.029
il4r.2
0.071
cirbpa
-0.029
agtr1b
0.070
ism1
-0.029
ncanb
0.070
stm
-0.029
epb41l4a
0.070
dkk1b
-0.029
si:ch73-144l3.1
0.070
foxa
-0.028
BX322555.4
0.069
fbxl3a
-0.028
atp11a
0.069
fgf8a
-0.028
si:dkey-7i4.23
0.069
FP102169.1
-0.028
negaly6
0.069
mespaa
-0.028
zgc:113232
0.069
si:ch211-222l21.1
-0.028
dnah1
0.068
wnt11f2
-0.028
BX890539.1
0.068
BX682556.1
-0.028
si:ch211-196h16.5
0.067
p4ha2
-0.027
afg1lb
0.067
kirrel3l
-0.027