Daniocell
apaf1 (ionocytes / mucous-producing)
apoptotic peptidase activating factor 1
ZFIN
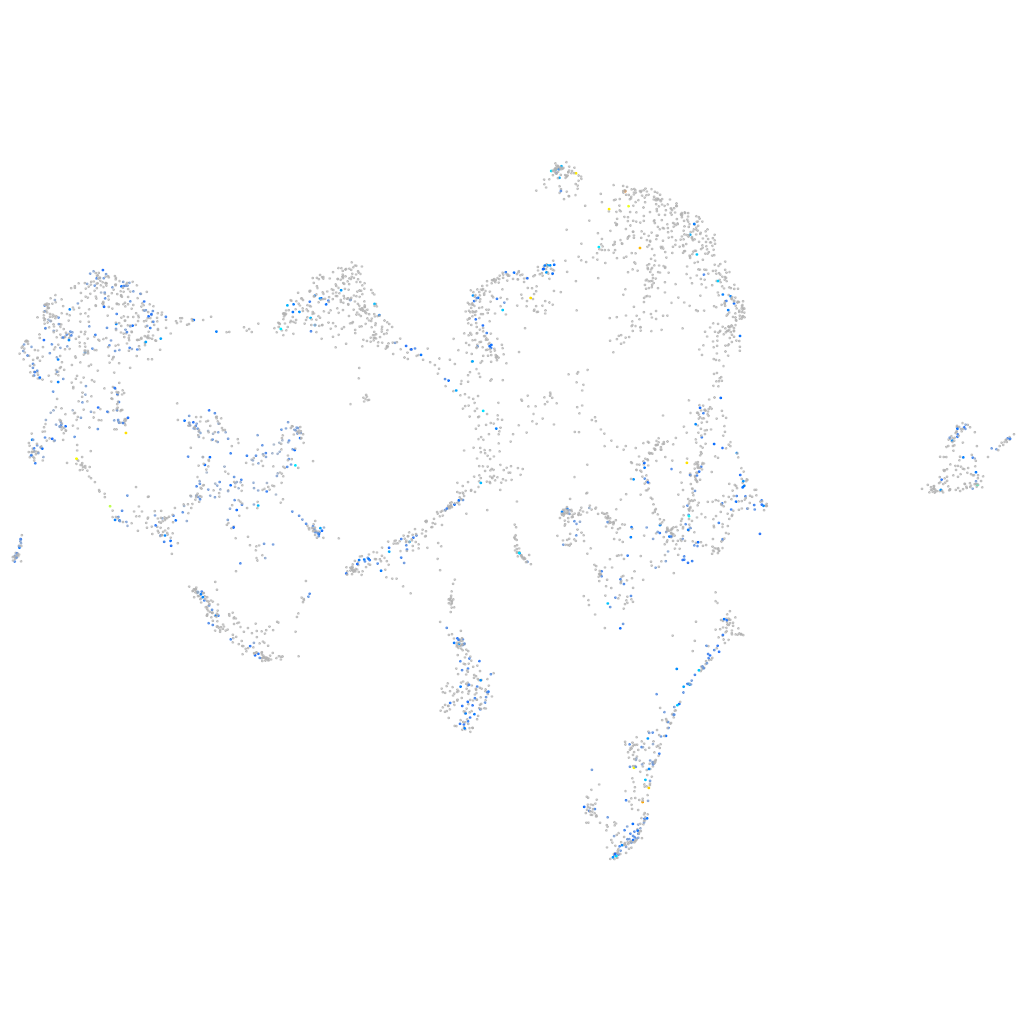
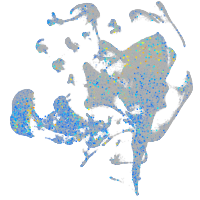
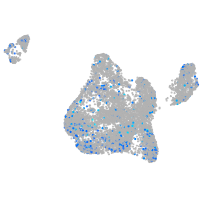
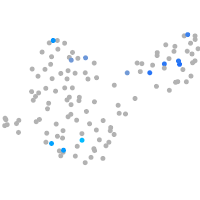
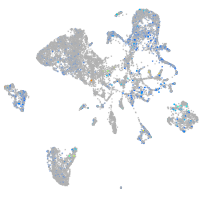
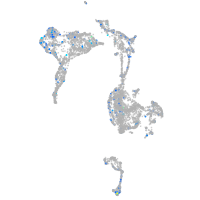
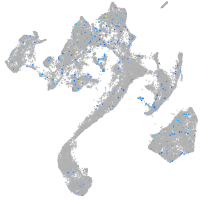
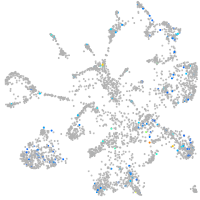
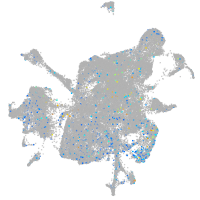
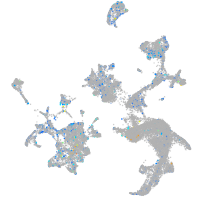
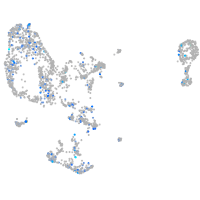
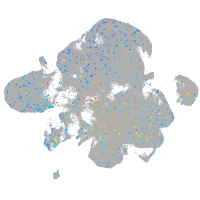
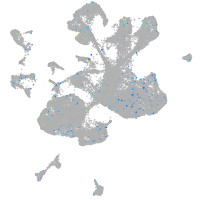
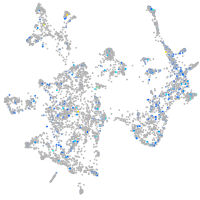
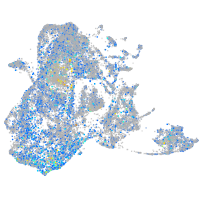
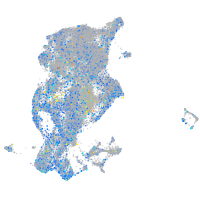
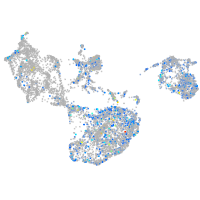
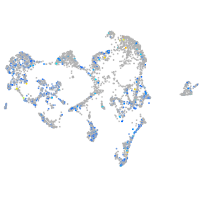
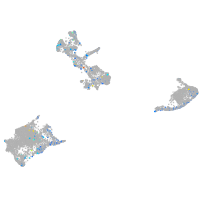
Gene expression UMAP
Display:
Expression
Stage
Other cell groups
all cells
blastomeres
PGCs
endoderm
axial mesoderm
muscle
mural cells /
non-skeletal muscle
mesenchyme
hematopoietic /
vasculature
pronephros
neural
spinal cord / glia
eye
taste / olfactory
otic / lateral line
epidermis
periderm
fin
ionocytes / mucous
pigment cells
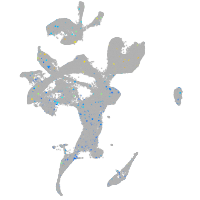
Expression by stage/cluster
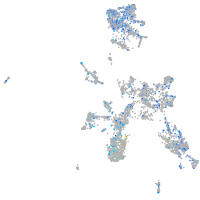
Correlated gene expression
Positive correlation
Negative correlation
Gene
r
Gene
r
CT573282.1
0.142
hbbe1.1
-0.063
BX248331.2
0.136
npdc1a
-0.062
LOC100538177
0.134
vill
-0.060
si:cabz01071909.2
0.134
p2rx1
-0.060
si:ch211-258f14.2
0.130
agr2
-0.056
CR450777.1
0.129
si:dkey-65b12.6
-0.055
LOC101883820
0.129
cers3b
-0.055
CT868708.1
0.123
tspan13a
-0.055
si:ch211-191i18.2
0.119
nupr1b
-0.055
BX530091.1
0.118
gng13b
-0.055
LOC562770
0.116
galnt8b.2
-0.054
si:ch211-194h1.2
0.115
ern2
-0.054
BX649516.4
0.115
muc5.1
-0.054
si:ch211-106j21.6
0.114
atp2a3
-0.053
LOC101887092
0.113
itpr3
-0.053
myl12.1
0.113
sytl2b
-0.052
kcnj12b
0.112
mir375-2
-0.052
zgc:101810
0.111
pvalb2
-0.052
XLOC-026756
0.111
tmed4
-0.052
htr2cl1
0.109
cmah
-0.051
pfn1
0.108
malb
-0.050
cldn20
0.108
BX000438.2
-0.050
il4
0.107
gngt2b
-0.050
col18a1a
0.107
osbpl9
-0.049
wdr47b
0.106
LOC110438378
-0.049
c3a.1
0.106
lad1
-0.049
s100a10b
0.106
ANO7
-0.048
mst1ra
0.106
zgc:101744
-0.048
LOC100330916
0.104
her2
-0.047
thbs1b
0.104
mylpfb
-0.047
ltb4r2a
0.104
cd63
-0.047
rpe65b
0.103
hbae1.1
-0.047
zyx
0.103
XLOC-003689
-0.047
znf408
0.102
ckmb
-0.047
tagln2
0.102
fev
-0.047