Daniocell
zmp:0000000760 (hematopoietic / vasculature)
zmp:0000000760
ZFIN
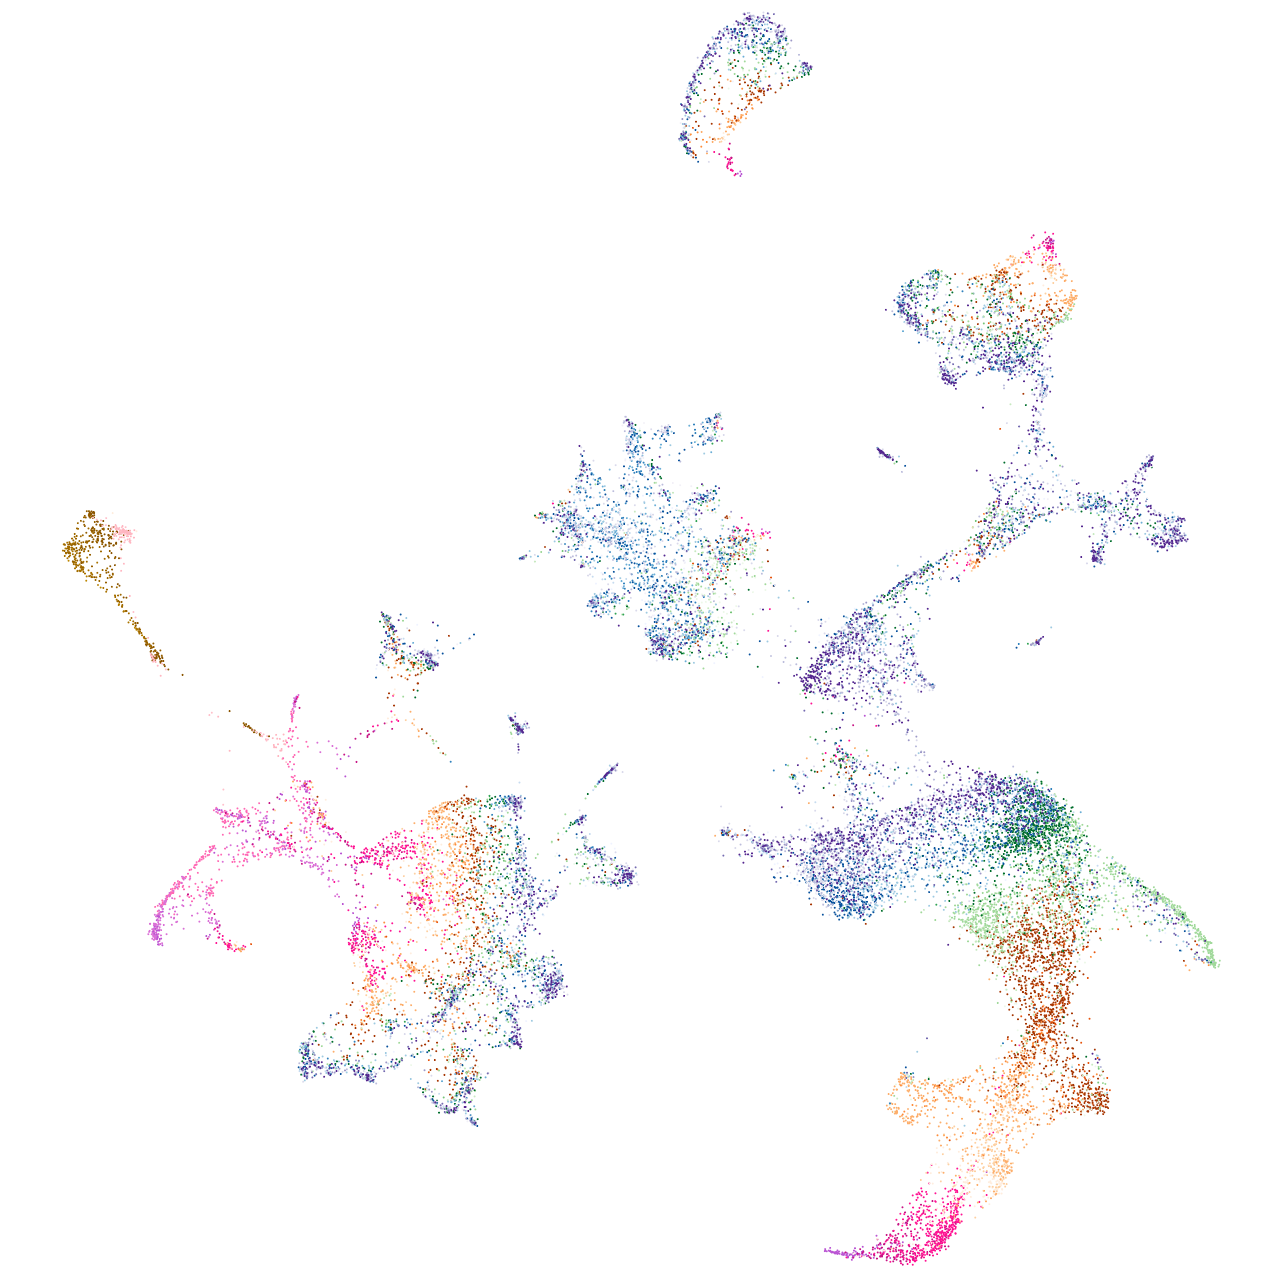
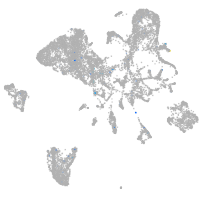
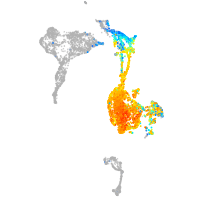
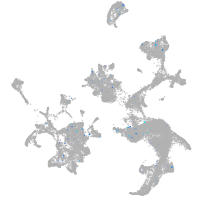
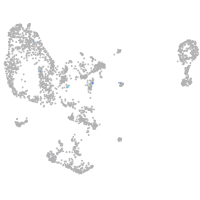
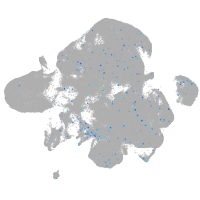
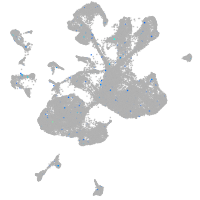
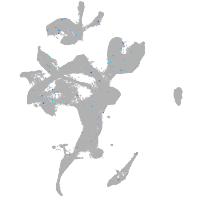
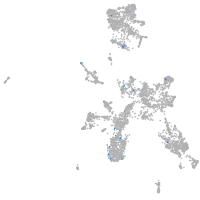
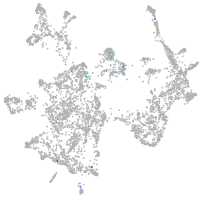
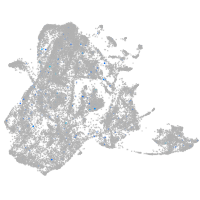
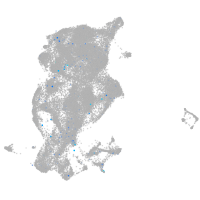
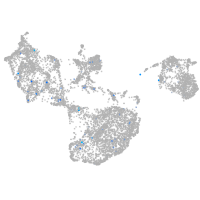
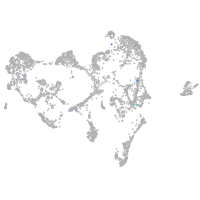
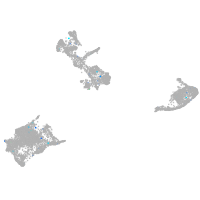
Gene expression UMAP
Display:
Expression
Stage
Other cell groups
all cells
blastomeres
PGCs
endoderm
axial mesoderm
muscle
mural cells /
non-skeletal muscle
mesenchyme
hematopoietic /
vasculature
pronephros
neural
spinal cord / glia
eye
taste / olfactory
otic / lateral line
epidermis
periderm
fin
ionocytes / mucous
pigment cells
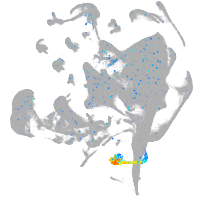
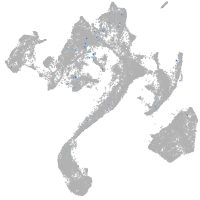
Expression by stage/cluster
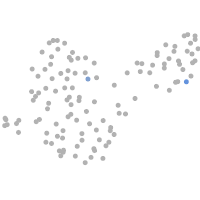
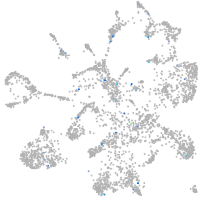
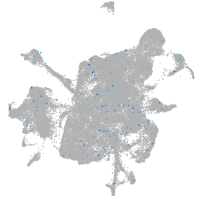
Correlated gene expression
Positive correlation
Negative correlation
Gene
r
Gene
r
rasal1a
0.147
fbl
-0.025
or115-11
0.124
nop58
-0.023
zgc:113232
0.122
eif3s10
-0.022
si:dkeyp-13d12.23
0.122
mybbp1a
-0.022
si:ch73-23l24.1
0.117
selenot1b
-0.022
LOC110439480
0.115
serbp1a
-0.021
CR388364.1
0.111
pabpc1a
-0.021
CABZ01052573.1
0.109
zgc:66433
-0.021
col9a1b
0.109
mphosph10
-0.020
si:ch211-209a2.2
0.107
blf
-0.020
LOC110439826
0.105
UTP14C
-0.020
LOC103911023
0.100
nop56
-0.020
cacng5b
0.097
eif2a
-0.020
slc38a8b
0.095
mak16
-0.020
LOC110440167
0.095
utp11l
-0.019
si:dkeyp-118a3.2
0.095
dkc1
-0.019
ngs
0.092
kat8
-0.019
matn3a
0.091
chchd2
-0.019
cmn
0.090
mdn1
-0.019
BX927300.1
0.088
si:dkey-239h2.3
-0.019
CR932983.1
0.086
timm9
-0.018
znf1085
0.083
noc3l
-0.018
vimr1
0.082
zgc:158803
-0.018
CR381579.2
0.078
cct7
-0.018
si:ch211-210b2.4
0.078
dek
-0.018
XLOC-030513
0.077
cldng
-0.018
mir125a-1
0.075
paics
-0.018
LOC796311
0.073
pnn
-0.018
LOC108181461
0.073
sart3
-0.018
arhgef38
0.073
tex10
-0.018
LOC100537040
0.072
twistnb
-0.018
birc5b
0.072
zranb2
-0.018
vegfba
0.071
wu:fb97g03
-0.017
XLOC-043742
0.071
prpf3
-0.017
paqr4b
0.070
sbds
-0.017