Daniocell
zgc:172341 (glial cells / spinal cord)
zgc:172341
ZFIN
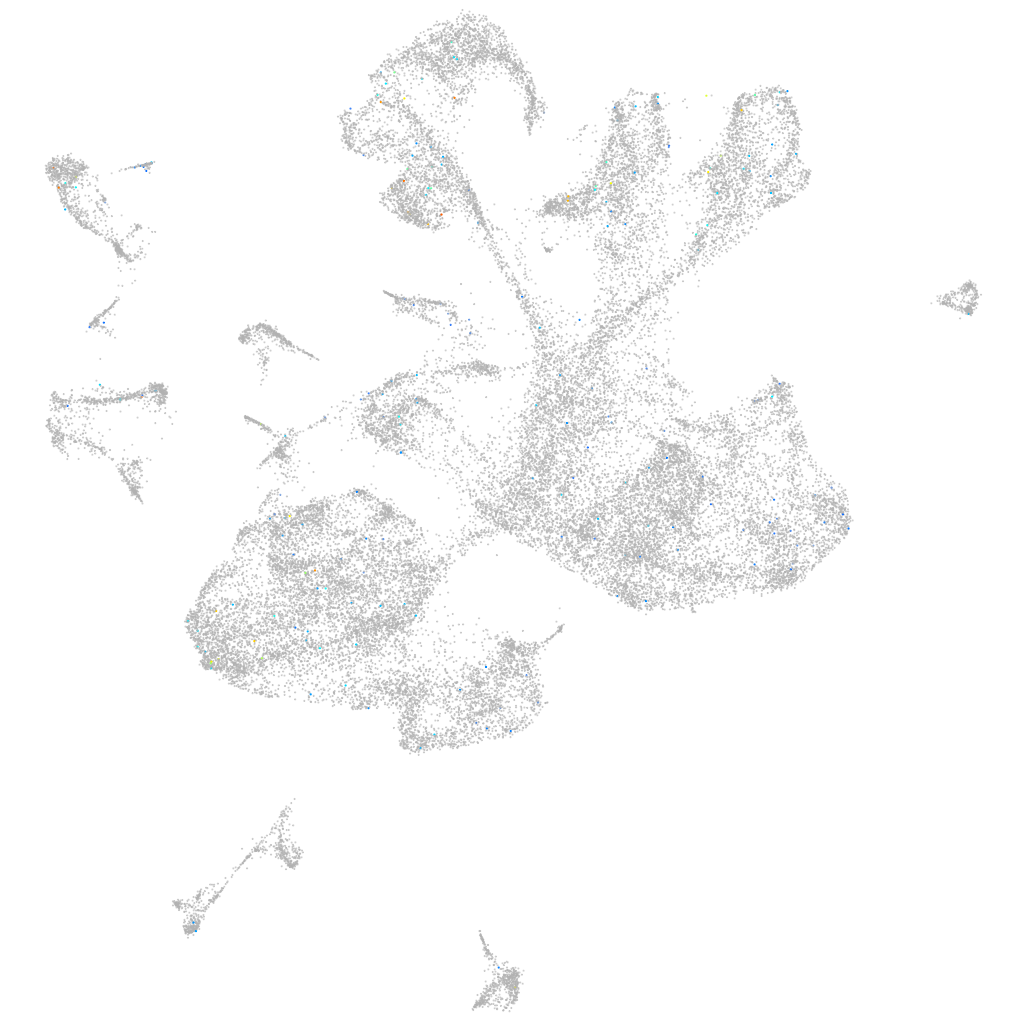
Gene expression UMAP
Display:
Expression
Stage
Other cell groups
all cells
blastomeres
PGCs
endoderm
axial mesoderm
muscle
mural cells /
non-skeletal muscle
mesenchyme
hematopoietic /
vasculature
pronephros
neural
spinal cord / glia
eye
taste / olfactory
otic / lateral line
epidermis
periderm
fin
ionocytes / mucous
pigment cells
Expression by stage/cluster
Correlated gene expression
Positive correlation
Negative correlation
Gene
r
Gene
r
si:dkey-16p6.4
0.142
rpsa
-0.042
CU469584.1
0.099
rps10
-0.041
tuba7l
0.097
rpl18a
-0.041
si:cabz01036006.1
0.094
eef1a1l1
-0.040
LO018022.2
0.086
rps7
-0.039
cxcr3.1
0.079
rps15a
-0.039
LOC101885108
0.079
rps12
-0.039
cpo
0.077
rps19
-0.039
CU062628.1
0.074
rplp1
-0.039
scpp8
0.073
rps23
-0.038
zbtb47a
0.071
rps24
-0.038
batf
0.070
rpl35a
-0.038
snphb
0.065
rps8a
-0.037
rp1
0.065
rpl11
-0.037
ptger2b
0.065
rpl8
-0.037
SLC5A7
0.063
rplp2l
-0.037
LOC110439873
0.062
rack1
-0.036
LOC100333235
0.061
rps20
-0.036
si:ch1073-155h21.2
0.061
hnrnpa0l
-0.036
LOC101885785
0.058
rpl9
-0.035
LOC103909513
0.058
rpl29
-0.035
BX649294.1
0.056
rps16
-0.034
LOC101885588
0.055
tpt1
-0.034
BX571707.1
0.055
rpl26
-0.034
si:dkeyp-79b7.3
0.055
rps27a
-0.034
si:ch211-250m6.7
0.054
rps26
-0.034
si:dkey-76b14.2
0.054
faua
-0.033
ccl38a.4
0.051
hmga1a
-0.033
LOC101884446
0.050
si:dkey-151g10.6
-0.033
birc7
0.050
rpl27
-0.033
FP340271.1
0.050
rpl7
-0.033
LOC100149554
0.049
hmgb2b
-0.032
adam12
0.049
hnrnpabb
-0.032
si:dkey-68o6.5
0.048
rpl17
-0.032
si:ch211-218h8.1
0.048
h2afvb
-0.032