Daniocell
zgc:172341 (blastomeres)
zgc:172341
ZFIN
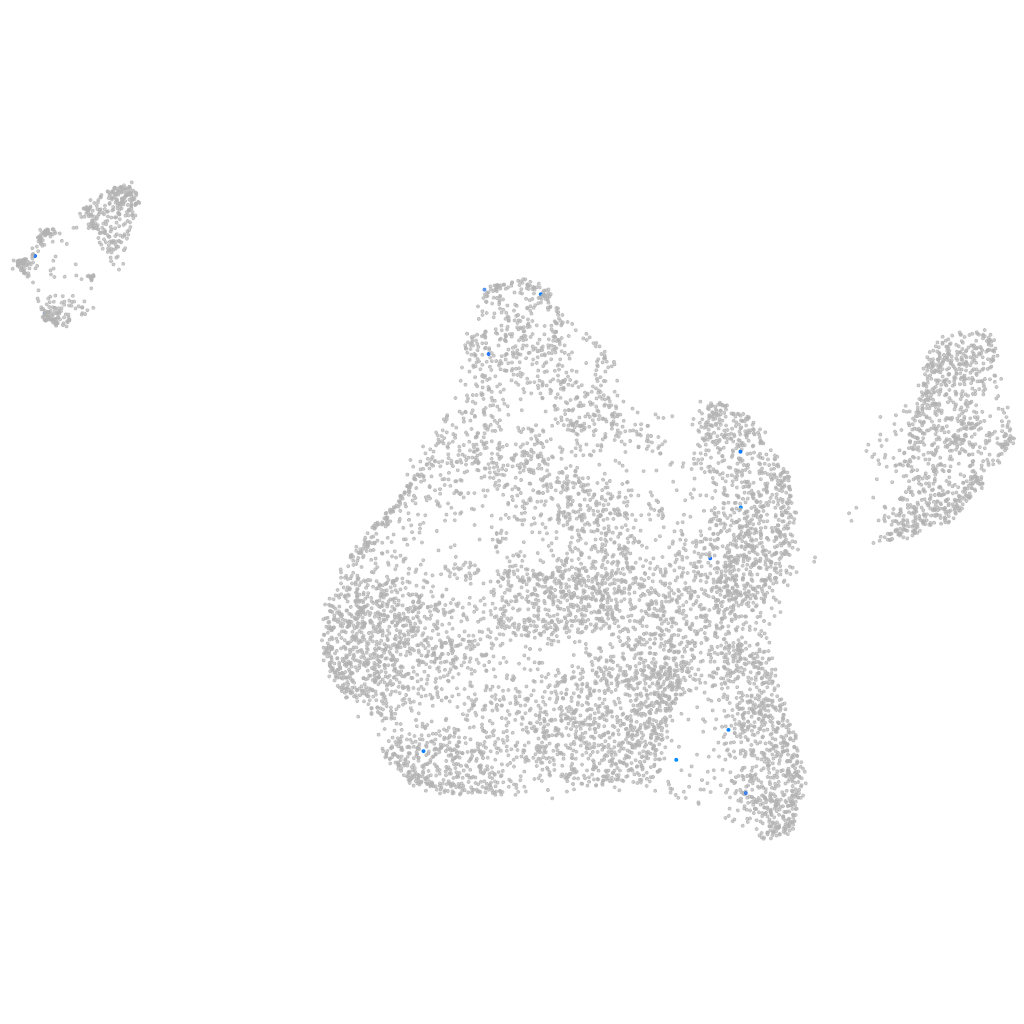
Gene expression UMAP
Display:
Expression
Stage
Other cell groups
all cells
blastomeres
PGCs
endoderm
axial mesoderm
muscle
mural cells /
non-skeletal muscle
mesenchyme
hematopoietic /
vasculature
pronephros
neural
spinal cord / glia
eye
taste / olfactory
otic / lateral line
epidermis
periderm
fin
ionocytes / mucous
pigment cells
Expression by stage/cluster
Correlated gene expression
Positive correlation
Negative correlation
Gene
r
Gene
r
CR376741.1
0.368
srsf1a
-0.041
CR318668.1
0.325
cirbpb
-0.028
LOC110437991
0.248
sp5l
-0.028
si:dkey-222h21.1
0.248
si:dkeyp-2e4.3
-0.027
si:dkey-222h21.9
0.248
uqcrq
-0.025
fga
0.234
llph
-0.024
si:dkey-190g11.3
0.202
hnrnpa0a
-0.023
LOC567521
0.197
nfil3-5
-0.022
CR926464.1
0.194
hnrnpabb
-0.022
LOC110439533
0.190
dbt
-0.021
CR318614.1
0.172
rbm4.2
-0.021
gpr4
0.160
ndufb8
-0.021
RF00007
0.155
hnrnpa0b
-0.020
CR812469.1
0.141
npm3
-0.020
pth1ra
0.139
si:zfos-1505d6.3
-0.020
p2ry13
0.137
cat
-0.019
dok2
0.126
hmgn6
-0.019
LOC101885494
0.125
eif3d
-0.019
CR381531.2
0.124
mex3b
-0.019
hoxc10a
0.123
ywhaz
-0.019
XLOC-023549
0.120
hmgb2b
-0.019
si:ch211-241e1.3
0.117
cdkn2aipnl
-0.019
gucy1b2
0.116
mrpl32
-0.019
zgc:175280
0.115
rbm8a
-0.018
rhoj
0.113
ubb
-0.018
zmp:0000001082
0.112
bud31
-0.018
tspan4a
0.112
otub1a
-0.018
arid5b
0.108
prrc2c
-0.018
hbaa2
0.106
sephs1
-0.018
zmp:0000001289
0.105
aldh2.2
-0.018
fgfrl1a
0.104
pcdh1b
-0.018
CR848723.1
0.104
plk1
-0.018
CU062633.1
0.101
decr2
-0.018
XLOC-000380
0.099
cdk1
-0.018
zmp:0000001127
0.096
srsf10b
-0.017