Daniocell
ythdf3 (mural cells / non-skeletal muscle)
YTH N(6)-methyladenosine RNA binding protein 3
ZFIN
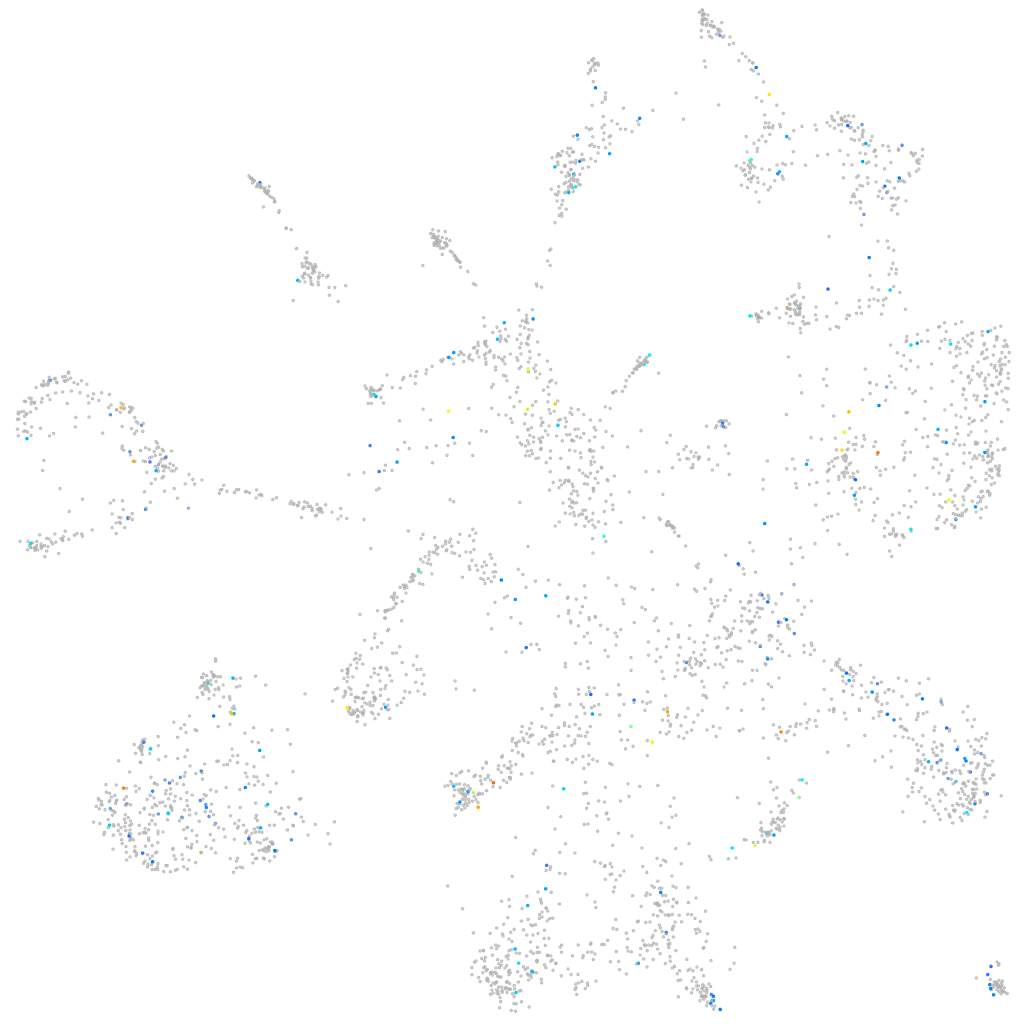
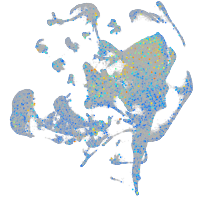
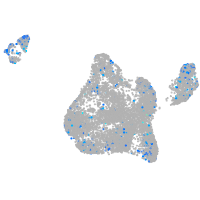
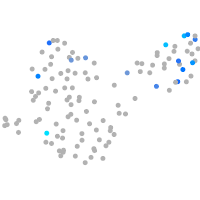
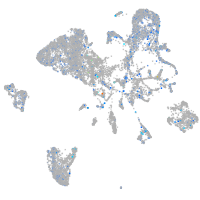
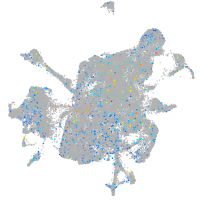
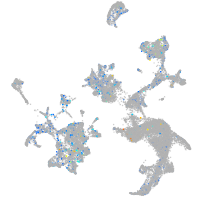
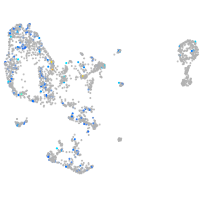
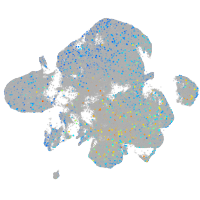
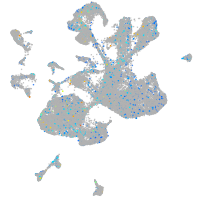
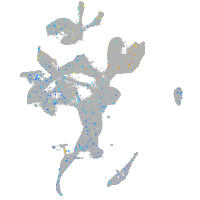
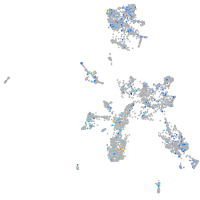
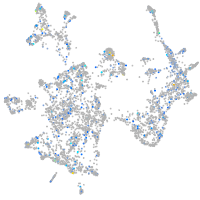
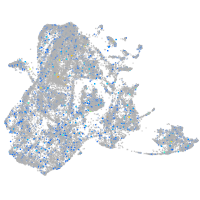
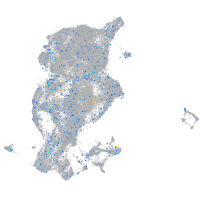
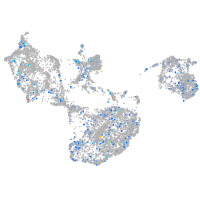
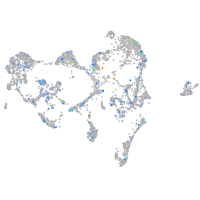
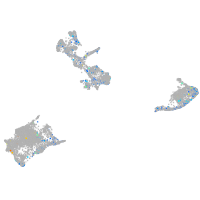
Gene expression UMAP
Display:
Expression
Stage
Other cell groups
all cells
blastomeres
PGCs
endoderm
axial mesoderm
muscle
mural cells /
non-skeletal muscle
mesenchyme
hematopoietic /
vasculature
pronephros
neural
spinal cord / glia
eye
taste / olfactory
otic / lateral line
epidermis
periderm
fin
ionocytes / mucous
pigment cells
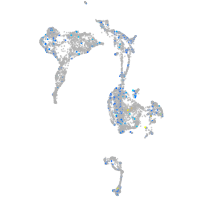
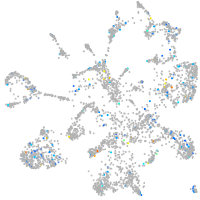
Expression by stage/cluster
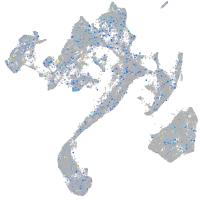
Correlated gene expression
Positive correlation
Negative correlation
Gene
r
Gene
r
trim35-9
0.175
pvalb1
-0.056
CR933017.1
0.163
col6a2
-0.050
clcn1a
0.158
tspan4b
-0.049
LOC100535286
0.154
zfyve21
-0.047
fam155a
0.152
col6a1
-0.047
LOC103910227
0.135
aoc2
-0.045
FO704721.2
0.134
chp2
-0.044
XLOC-016838
0.133
rpl7
-0.043
crygm2d5
0.122
mylpfb
-0.043
cpeb1b
0.122
iba57
-0.042
CABZ01058452.1
0.119
tnnt3b
-0.042
LOC103911624
0.116
vdrb
-0.042
alk
0.114
eaf1
-0.042
LOC110438040
0.114
mfap2
-0.040
mtmr7b
0.111
bmp16
-0.040
cwc15
0.108
zgc:65873
-0.040
BX537274.2
0.107
calr3a
-0.040
si:ch211-143l19.3
0.106
ybx1
-0.040
si:dkey-14d8.22
0.102
bgnb
-0.040
si:ch211-227e10.1
0.102
anxa3b
-0.039
tmbim4
0.102
tinagl1
-0.039
LAMP5
0.101
rps21
-0.039
slc5a8
0.101
atf6
-0.039
cyp17a1
0.099
eef1da
-0.039
XLOC-033378
0.099
mpc1
-0.038
eef1a1b
0.099
tex10
-0.038
setd9
0.098
tmem203
-0.038
rnf212
0.096
zranb2
-0.038
trim33l
0.095
si:ch211-62a1.3
-0.038
zgc:194908
0.095
CABZ01032488.1
-0.038
gsdf
0.095
txlna
-0.038
si:ch211-186j3.6
0.095
si:ch211-71n6.4
-0.038
CABZ01067973.1
0.093
myl12.1
-0.037
AL928657.1
0.093
arpc2
-0.037
fam43b
0.093
tpm1
-0.037