Daniocell
xirp2b (eye)
xin actin binding repeat containing 2b
ZFIN
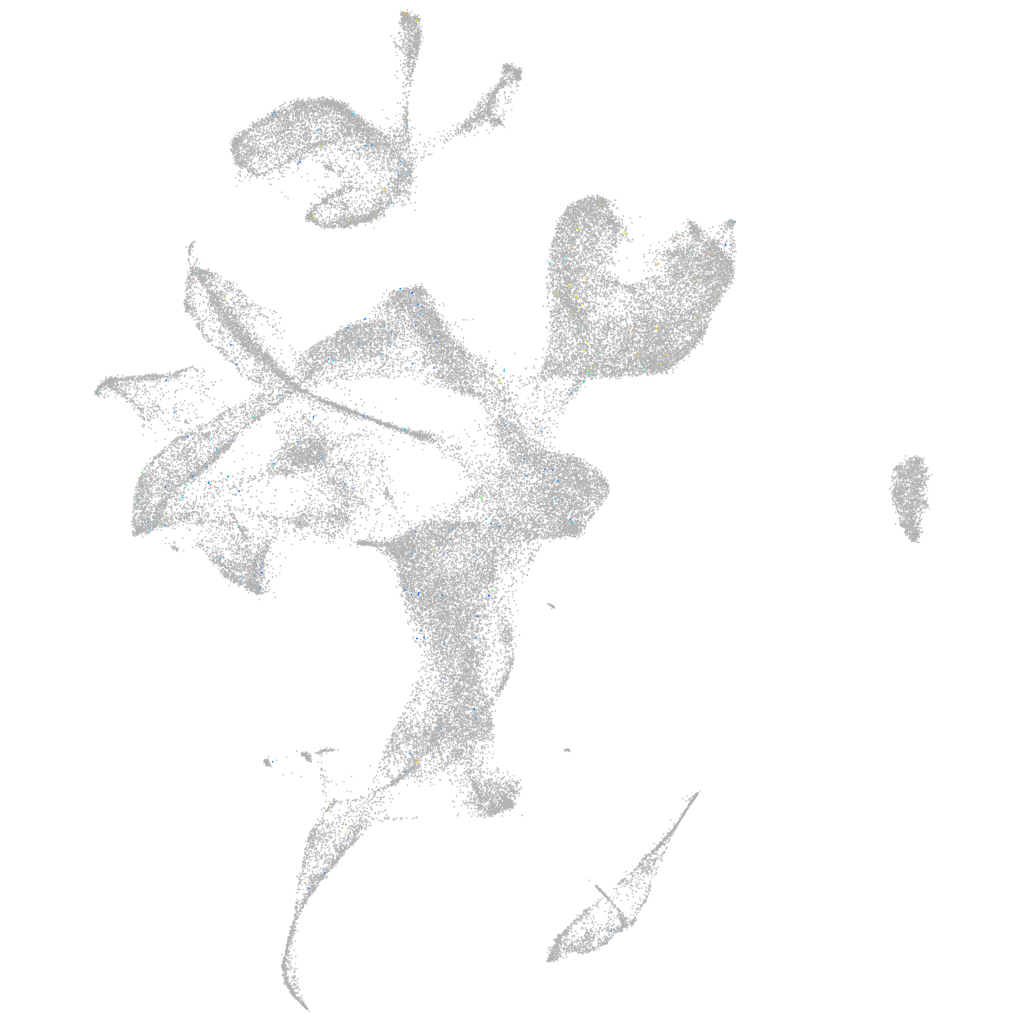
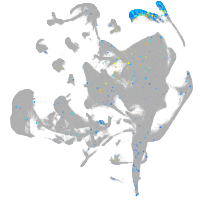
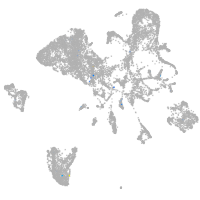
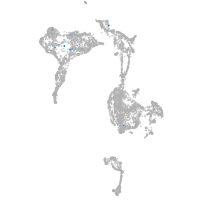
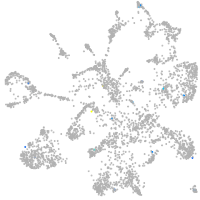
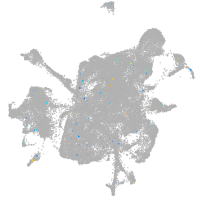
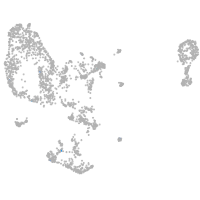
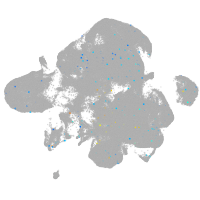
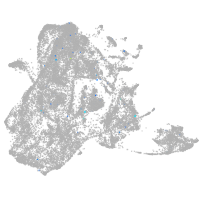
Gene expression UMAP
Display:
Expression
Stage
Other cell groups
all cells
blastomeres
PGCs
endoderm
axial mesoderm
muscle
mural cells /
non-skeletal muscle
mesenchyme
hematopoietic /
vasculature
pronephros
neural
spinal cord / glia
eye
taste / olfactory
otic / lateral line
epidermis
periderm
fin
ionocytes / mucous
pigment cells
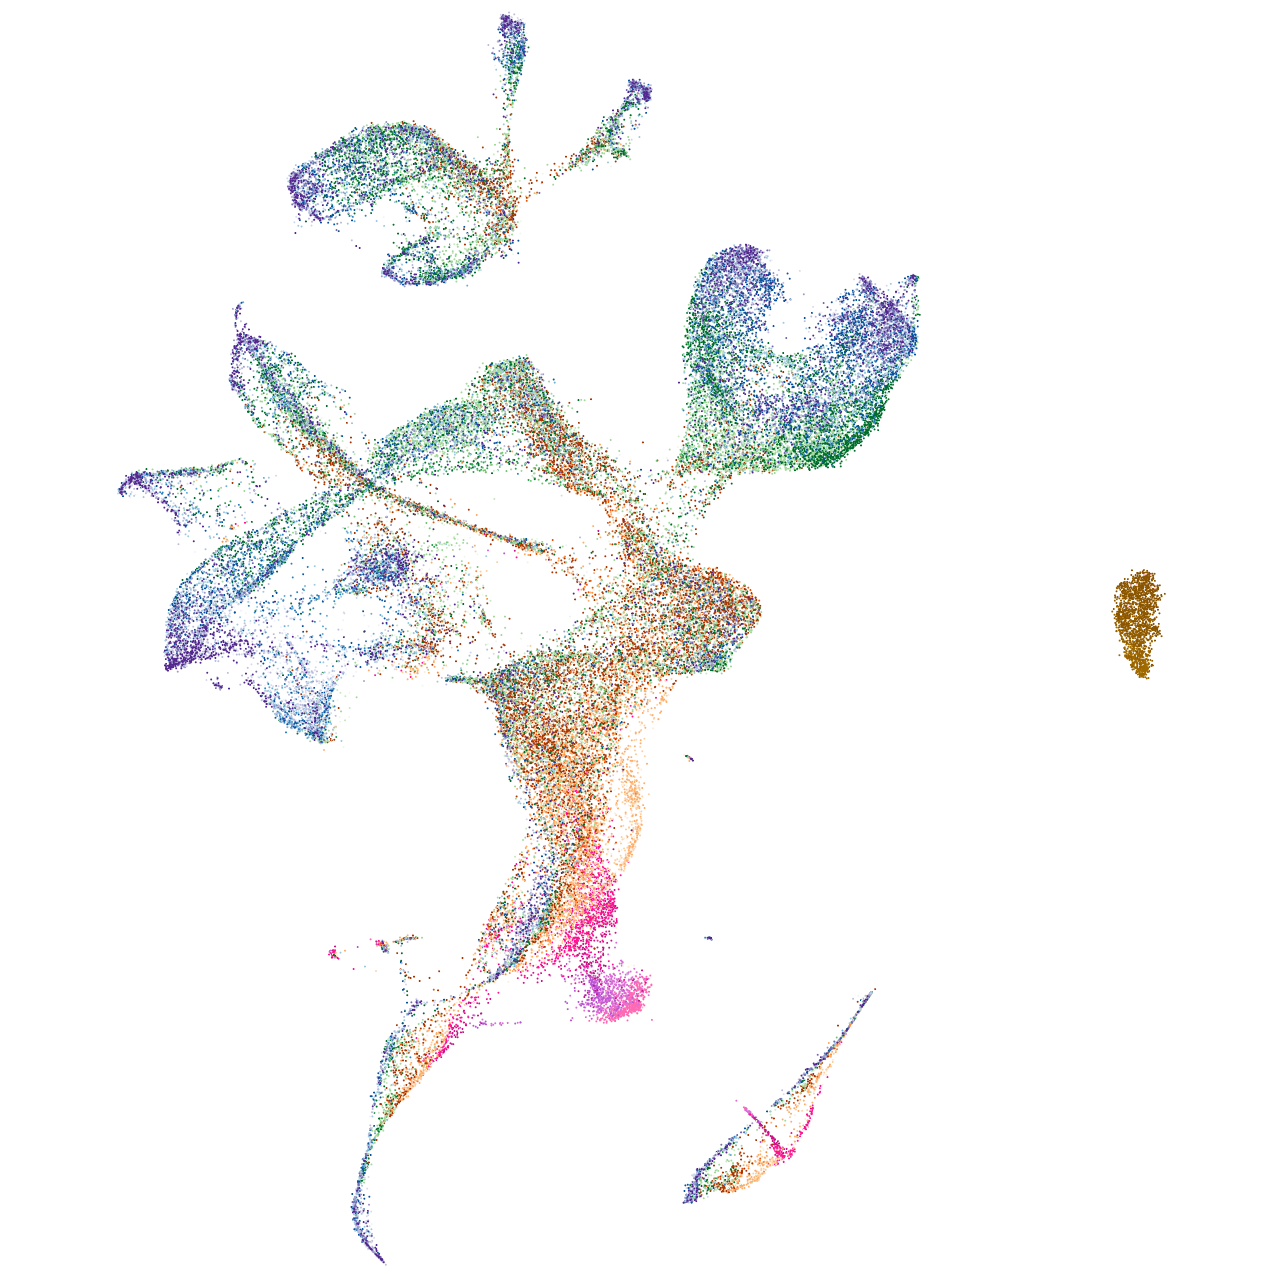
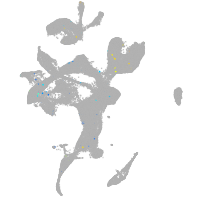
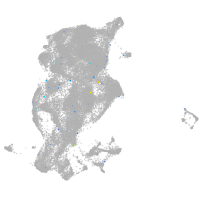
Expression by stage/cluster
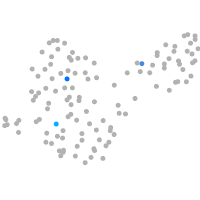
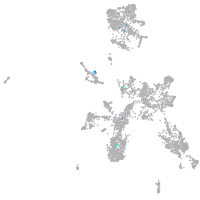
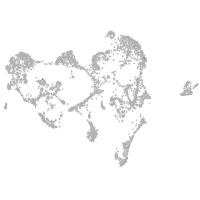
Correlated gene expression
Positive correlation
Negative correlation
Gene
r
Gene
r
LOC103910909
0.089
cirbpa
-0.029
LOC103911814.1
0.082
eif2s2
-0.024
LOC101887108
0.079
rpl32
-0.021
or109-11
0.077
ppiaa
-0.021
si:dkey-30c15.13
0.075
rpl15
-0.021
LOC108183355
0.075
snrpd2
-0.021
sowahaa
0.071
eef2b
-0.020
si:dkey-151j17.4
0.070
rpl5b
-0.020
LOC110439303
0.066
rpl29
-0.020
CABZ01068499.1
0.065
tpt1
-0.020
nkx2.5
0.062
rpl38
-0.020
si:ch73-27e22.2
0.060
eif4a1a
-0.020
LOC108190059.1
0.059
tcp1
-0.020
tmc8
0.056
snrpb
-0.020
kcna7
0.055
snu13b
-0.020
si:ch73-261i21.2
0.054
rps18
-0.019
si:ch211-125c23.3
0.053
mibp2
-0.019
zmp:0000001161
0.051
rpl13a
-0.019
mhc1uma
0.049
sub1a
-0.019
itih2
0.049
nop10
-0.019
si:ch73-329n5.2
0.049
rpl9
-0.019
LOC110439374
0.049
banf1
-0.018
BX470154.1
0.048
nap1l1
-0.018
BX664625.2
0.048
eif5a2
-0.018
XLOC-024828
0.047
ctnnb1
-0.018
LOC108181236
0.046
apex1
-0.018
CT025651.1
0.045
rpl36a
-0.018
kcnk13a
0.045
anp32b
-0.018
LOC110438094
0.044
mcm7
-0.018
XLOC-043131
0.044
top1l
-0.018
syt1b
0.042
abcf1
-0.018
cx28.8
0.042
rps8a
-0.018
stpg2
0.040
vcp
-0.018
nfatc4
0.040
rpl8
-0.018
qrfpr4
0.040
pdap1a
-0.018