Daniocell
wbp1lb (neural)
WW domain binding protein 1-like b
ZFIN
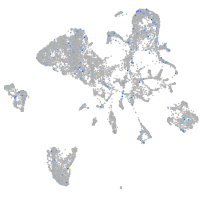
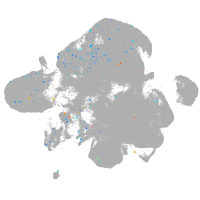
Gene expression UMAP
Display:
Expression
Stage
Other cell groups
all cells
blastomeres
PGCs
endoderm
axial mesoderm
muscle
mural cells /
non-skeletal muscle
mesenchyme
hematopoietic /
vasculature
pronephros
neural
spinal cord / glia
eye
taste / olfactory
otic / lateral line
epidermis
periderm
fin
ionocytes / mucous
pigment cells
Expression by stage/cluster
Correlated gene expression
Positive correlation
Negative correlation
Gene
r
Gene
r
LOC110438363
0.112
elavl3
-0.036
BX248410.3
0.091
rtn1a
-0.036
dpt
0.078
tuba1c
-0.034
agtr1a
0.074
ptmaa
-0.033
si:ch211-106j21.6
0.072
stmn1b
-0.033
si:ch211-8c17.2
0.063
nova2
-0.032
XLOC-013086
0.062
gpm6aa
-0.031
LOC103909812
0.062
hmgb3a
-0.030
LOC100537733
0.061
zc4h2
-0.030
rgs1
0.059
marcksl1b
-0.029
helz2
0.056
tmsb4x
-0.028
LOC101885631
0.056
tubb5
-0.027
si:dkey-22l1.1
0.055
tmeff1b
-0.027
asah2
0.055
sncb
-0.027
LOC108190816
0.052
tmsb
-0.026
si:ch211-198m17.1
0.052
atp6v0cb
-0.026
LOC100537272
0.051
gng3
-0.026
st3gal1l
0.051
myt1a
-0.025
LOC103910136
0.051
gpm6ab
-0.025
LOC103911485
0.048
h2afx1
-0.024
cx35.4
0.048
si:dkey-276j7.1
-0.024
entpd8
0.048
stx1b
-0.024
vwa11
0.048
ywhah
-0.024
BX322618.1
0.047
myt1b
-0.024
XLOC-016089
0.046
tuba1a
-0.024
tspan34
0.045
ptmab
-0.024
BX323016.1
0.045
ckbb
-0.024
CLEC3A
0.045
ubc
-0.023
si:ch211-76m11.15
0.044
elavl4
-0.023
CABZ01073083.1
0.044
fam168a
-0.023
hepacam2
0.044
gng2
-0.023
cspg4
0.044
rnasekb
-0.023
XLOC-028370
0.043
hmgb1a
-0.023
adgrf8
0.042
marcksl1a
-0.022
gpr183a
0.042
rtn1b
-0.022