Daniocell
wbp1lb (fin)
WW domain binding protein 1-like b
ZFIN
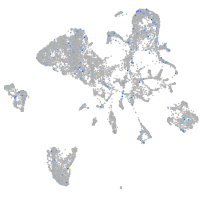
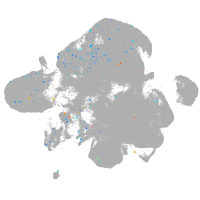
Gene expression UMAP
Display:
Expression
Stage
Other cell groups
all cells
blastomeres
PGCs
endoderm
axial mesoderm
muscle
mural cells /
non-skeletal muscle
mesenchyme
hematopoietic /
vasculature
pronephros
neural
spinal cord / glia
eye
taste / olfactory
otic / lateral line
epidermis
periderm
fin
ionocytes / mucous
pigment cells
Expression by stage/cluster
Correlated gene expression
Positive correlation
Negative correlation
Gene
r
Gene
r
LOC103911204
0.187
selenof
-0.044
usp28
0.185
si:ch211-222l21.1
-0.043
crygm2d13
0.175
calr3b
-0.043
zmp:0000000845
0.165
kdelr2a
-0.042
LOC100331751
0.153
dad1
-0.041
zgc:112408
0.150
h3f3d
-0.041
LO017850.1
0.150
h2afva
-0.041
CABZ01112461.1
0.140
CABZ01058650.1
-0.040
CR392341.1
0.136
sec61b
-0.039
si:dkey-203a12.2
0.132
golt1bb
-0.039
si:dkey-239i20.2
0.132
tram1
-0.038
CU041345.1
0.127
calua
-0.038
CT583625.5
0.125
sub1a
-0.037
si:ch73-205h11.1
0.125
ddost
-0.037
comtd1
0.117
zgc:153675
-0.037
BX571884.1
0.116
tmem263
-0.037
tpo
0.116
copz2
-0.037
LOC103909634
0.115
ier3ip1
-0.036
AL831745.1
0.115
rab6a
-0.035
ttc7a
0.114
cisd2
-0.035
tyrobp
0.112
tmem258
-0.035
nphs2
0.111
ccdc3a
-0.034
LOC110440062
0.110
rpl36
-0.034
acp2
0.109
lamb1a
-0.034
vps13a
0.104
fkbp9
-0.034
fgfr1bl
0.103
inka1b
-0.034
slc25a14
0.103
pmp22a
-0.034
kcnj3b
0.103
ptmab
-0.034
clic5b
0.103
fkbp11
-0.034
rtn4r
0.103
hnrnpaba
-0.033
rasl10a
0.101
h2afvb
-0.033
tmem200a
0.101
tmco1
-0.033
fam84b
0.100
phgdh
-0.033
LOC100537040
0.099
ptges3b
-0.033
hspb6
0.098
bhmt
-0.033