Daniocell
vps33a (fin)
VPS33A core subunit of CORVET and HOPS complexes
ZFIN
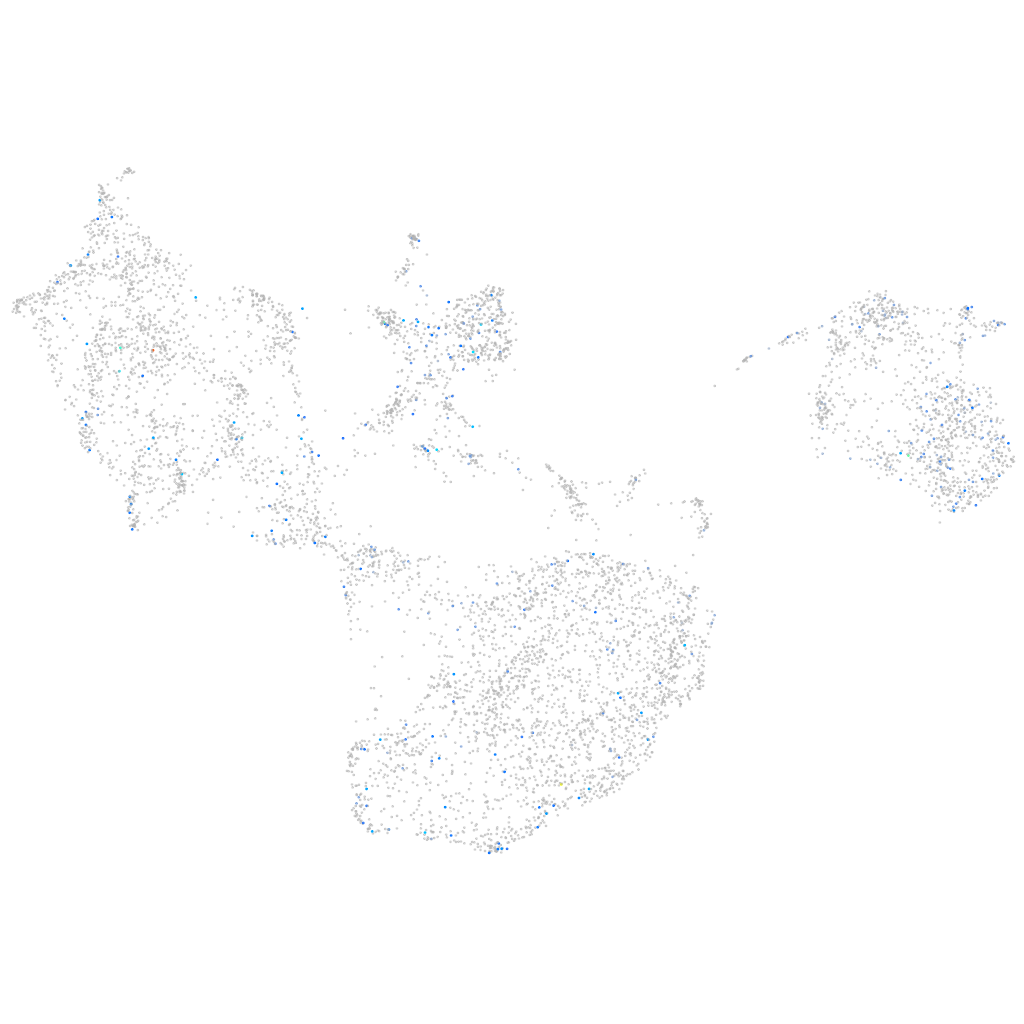
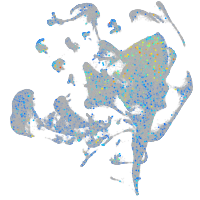
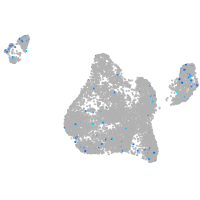
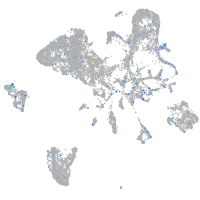
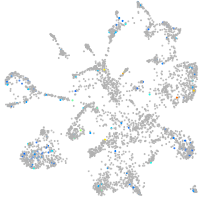
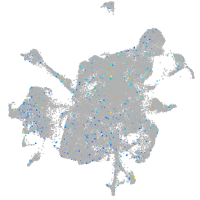
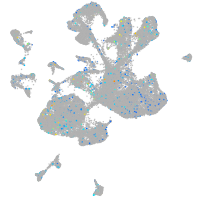
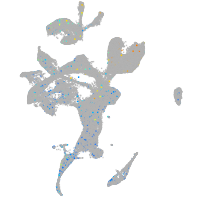
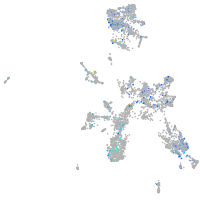
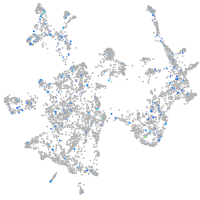
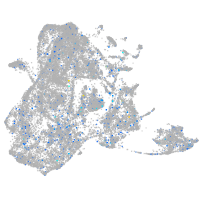
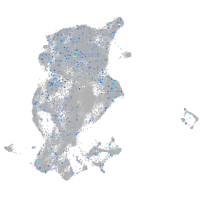
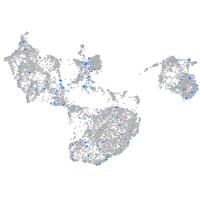
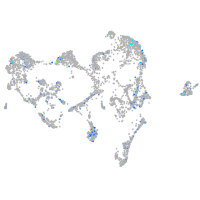
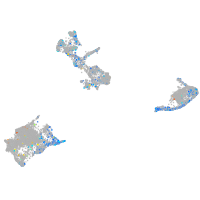
Gene expression UMAP
Display:
Expression
Stage
Other cell groups
all cells
blastomeres
PGCs
endoderm
axial mesoderm
muscle
mural cells /
non-skeletal muscle
mesenchyme
hematopoietic /
vasculature
pronephros
neural
spinal cord / glia
eye
taste / olfactory
otic / lateral line
epidermis
periderm
fin
ionocytes / mucous
pigment cells
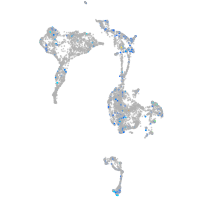
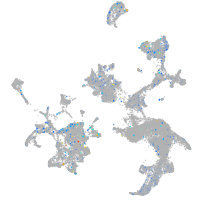
Expression by stage/cluster
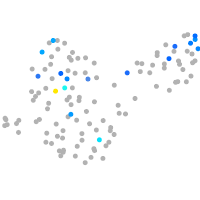
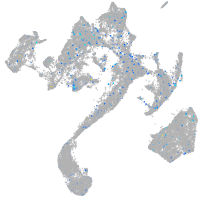
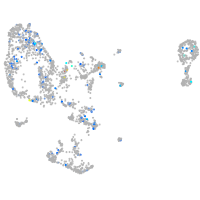
Correlated gene expression
Positive correlation
Negative correlation
Gene
r
Gene
r
XLOC-013609
0.128
rpl38
-0.051
lhx8b
0.127
rps29
-0.040
crygmxl2
0.125
rpl29
-0.039
rida
0.117
ttc36
-0.037
BX927122.2
0.115
rpl39
-0.034
cacng5a
0.108
si:dkey-151g10.6
-0.034
XLOC-025468
0.108
hpdb
-0.032
pabpc1l
0.108
postnb
-0.032
CABZ01083778.1
0.107
myhz1.2
-0.031
LOC108190166
0.106
bhmt
-0.031
map3k7cl
0.104
actc1b
-0.030
LOC103911338
0.103
pvalb2
-0.029
FITM1 (1 of many)
0.099
pvalb1
-0.029
XLOC-017423
0.098
ucp1
-0.029
tmtopsb
0.098
rps21
-0.028
BX324142.2
0.096
rpl36
-0.028
gabrb2l
0.095
tat
-0.027
BX539313.1
0.095
hgd
-0.026
LO017802.1
0.095
si:dkey-12l12.1
-0.026
FP016019.1
0.094
gstz1
-0.026
odf3l2b
0.093
tgm2b
-0.025
BX470189.2
0.091
fgfr4
-0.025
CR847523.1
0.091
krt91
-0.025
zgc:92040
0.091
abi3bpb
-0.025
XLOC-003075
0.091
lgals1l1
-0.024
CABZ01057364.2
0.090
rplp1
-0.024
slc7a9
0.089
DSG2
-0.024
zgc:114120
0.089
ttn.1
-0.024
BX548032.1
0.089
mab21l2
-0.024
opn1mw3
0.088
fn1b
-0.024
XLOC-036361
0.088
gpd1b
-0.023
p2ry11
0.086
vstm4a
-0.023
FO681390.1
0.086
XLOC-008494
-0.023
LOC103912023
0.086
sp1
-0.023
LOC792447
0.085
capn12
-0.023