Daniocell
ufsp1 (pigment cells)
UFM1-specific peptidase 1 (non-functional)
ZFIN
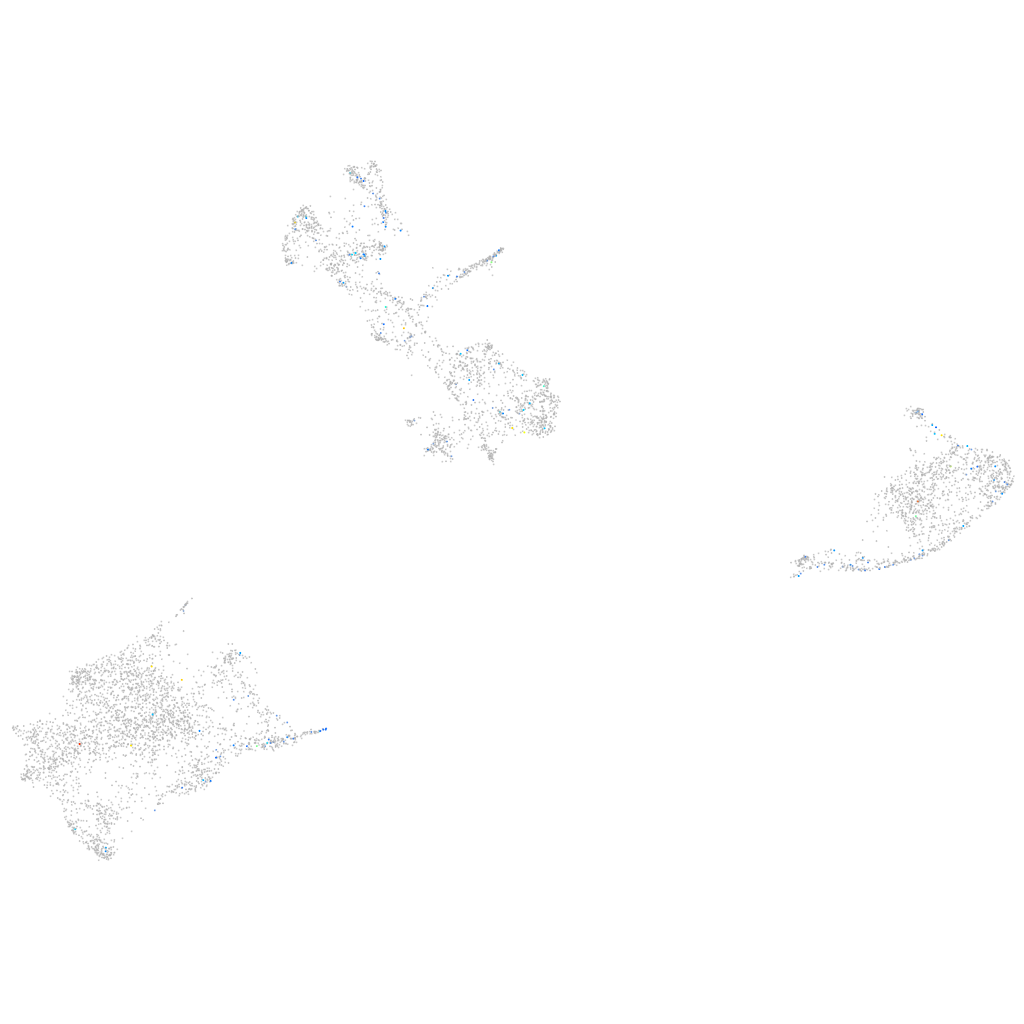
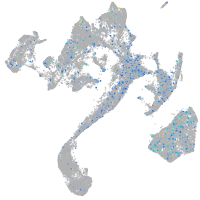
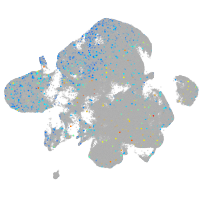
Gene expression UMAP
Display:
Expression
Stage
Other cell groups
all cells
blastomeres
PGCs
endoderm
axial mesoderm
muscle
mural cells /
non-skeletal muscle
mesenchyme
hematopoietic /
vasculature
pronephros
neural
spinal cord / glia
eye
taste / olfactory
otic / lateral line
epidermis
periderm
fin
ionocytes / mucous
pigment cells
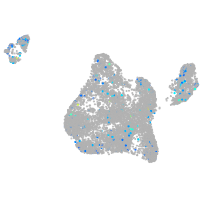
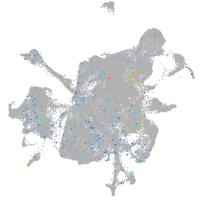
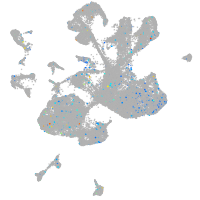
Expression by stage/cluster
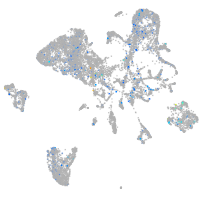
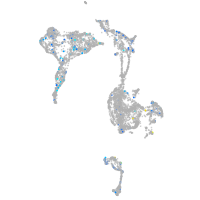
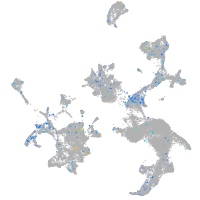
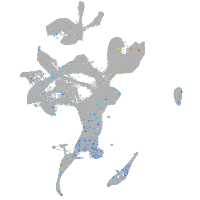
Correlated gene expression
Positive correlation
Negative correlation
Gene
r
Gene
r
MARCH4 (1 of many)
0.161
CABZ01021592.1
-0.053
si:dkey-282h22.5
0.159
aqp3a
-0.052
drd2l
0.132
si:dkey-251i10.2
-0.051
cradd
0.131
slc22a7a
-0.050
CR628327.1
0.130
si:ch211-251b21.1
-0.046
gabrr2b
0.129
pvalb2
-0.046
LOC100537845
0.120
cd63
-0.044
zmynd10
0.113
tmem130
-0.044
si:ch211-205a14.7
0.106
actc1b
-0.043
CU929312.1
0.104
pts
-0.043
csf3b
0.100
gch2
-0.042
LOC570526
0.099
uraha
-0.041
XLOC-014147
0.097
myhz1.1
-0.041
LOC100149669
0.096
gstp1
-0.040
XLOC-006561
0.096
zgc:110339
-0.040
LOC103909492
0.095
aldob
-0.039
trim66
0.093
hbbe1.1
-0.038
BX927181.2
0.093
pvalb1
-0.037
AL928650.2
0.092
bco1
-0.036
klhl40a
0.091
mylpfa
-0.035
si:dkey-285b23.3
0.090
bscl2l
-0.035
XLOC-038909
0.089
hbbe1.3
-0.034
ms4a17a.1
0.089
icn
-0.033
mir196b
0.087
marcksl1b
-0.032
LOC108190785
0.085
zgc:113337
-0.031
XLOC-042882
0.085
asip2b
-0.031
kcna4
0.083
mibp
-0.031
XLOC-033512
0.083
cyb561a3b
-0.029
gpr78a
0.082
aldh1l1
-0.029
CR545469.1
0.081
oacyl
-0.029
CR847895.1
0.081
tnnt3b
-0.029
BX255897.1
0.081
s100a10b
-0.029
hspe1
0.081
ttn.1
-0.029
tfap2b
0.081
myhz2
-0.029
CABZ01032351.1
0.081
aox5
-0.028