Daniocell
ttyh3a (mural cells / non-skeletal muscle)
tweety family member 3a
ZFIN
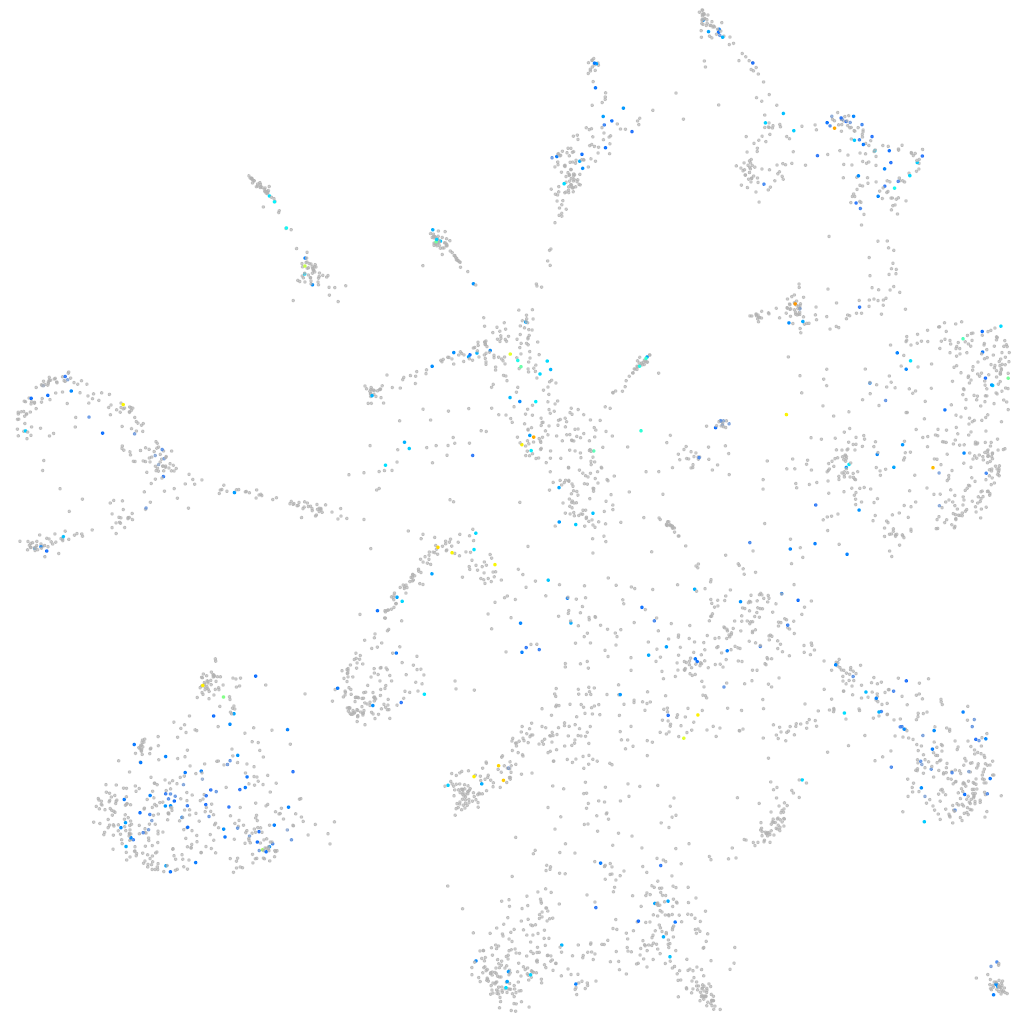
Gene expression UMAP
Display:
Expression
Stage
Other cell groups
all cells
blastomeres
PGCs
endoderm
axial mesoderm
muscle
mural cells /
non-skeletal muscle
mesenchyme
hematopoietic /
vasculature
pronephros
neural
spinal cord / glia
eye
taste / olfactory
otic / lateral line
epidermis
periderm
fin
ionocytes / mucous
pigment cells
Expression by stage/cluster
Correlated gene expression
Positive correlation
Negative correlation
Gene
r
Gene
r
RAB19
0.149
mylkb
-0.077
si:ch211-156l18.7
0.111
rpl24
-0.069
CABZ01089980.1
0.111
rps21
-0.063
CR293531.2
0.111
rplp1
-0.060
LOC108179116
0.110
si:ch211-62a1.3
-0.060
slc2a11a
0.109
acta2
-0.060
CABZ01041604.1
0.104
tagln
-0.060
LOC564237
0.103
rpl22
-0.060
ebf1b
0.103
lmod1b
-0.056
tat
0.102
myl9a
-0.056
dusp3b
0.101
nkx2.3
-0.055
si:rp71-39b20.4
0.101
myl6
-0.054
CABZ01068356.1
0.099
myh11a
-0.054
CU459056.1
0.098
cald1b
-0.053
slc6a14
0.098
gucy1b1
-0.052
dab2ipa
0.098
foxf1
-0.052
kcnj12a
0.095
gucy1a1
-0.050
slc1a7a
0.093
si:dkey-151g10.6
-0.050
pcdh15a
0.093
hlx1
-0.049
si:ch211-198m17.1
0.093
desmb
-0.049
BX005129.4
0.093
cnn1b
-0.048
sfrp5
0.092
ntn5
-0.048
gabrr2b
0.092
cfd
-0.047
hhipl2
0.092
csrp1b
-0.045
alpi.1
0.092
rprmb
-0.045
CABZ01081490.1
0.091
XLOC-041870
-0.045
GPR68
0.091
tpm2
-0.045
zgc:198371
0.091
col4a6
-0.043
gdpd3a
0.091
rpl17
-0.043
aqp10b
0.091
rpl29
-0.042
si:dkey-24p1.6
0.090
akap7
-0.042
LOC101884753
0.090
ela3l
-0.042
araf
0.089
BX901920.1
-0.042
XLOC-029870
0.089
oprl1
-0.042
arl6ip5a
0.087
kcnk18
-0.041