Daniocell
trim2a (epidermis)
tripartite motif containing 2a
ZFIN
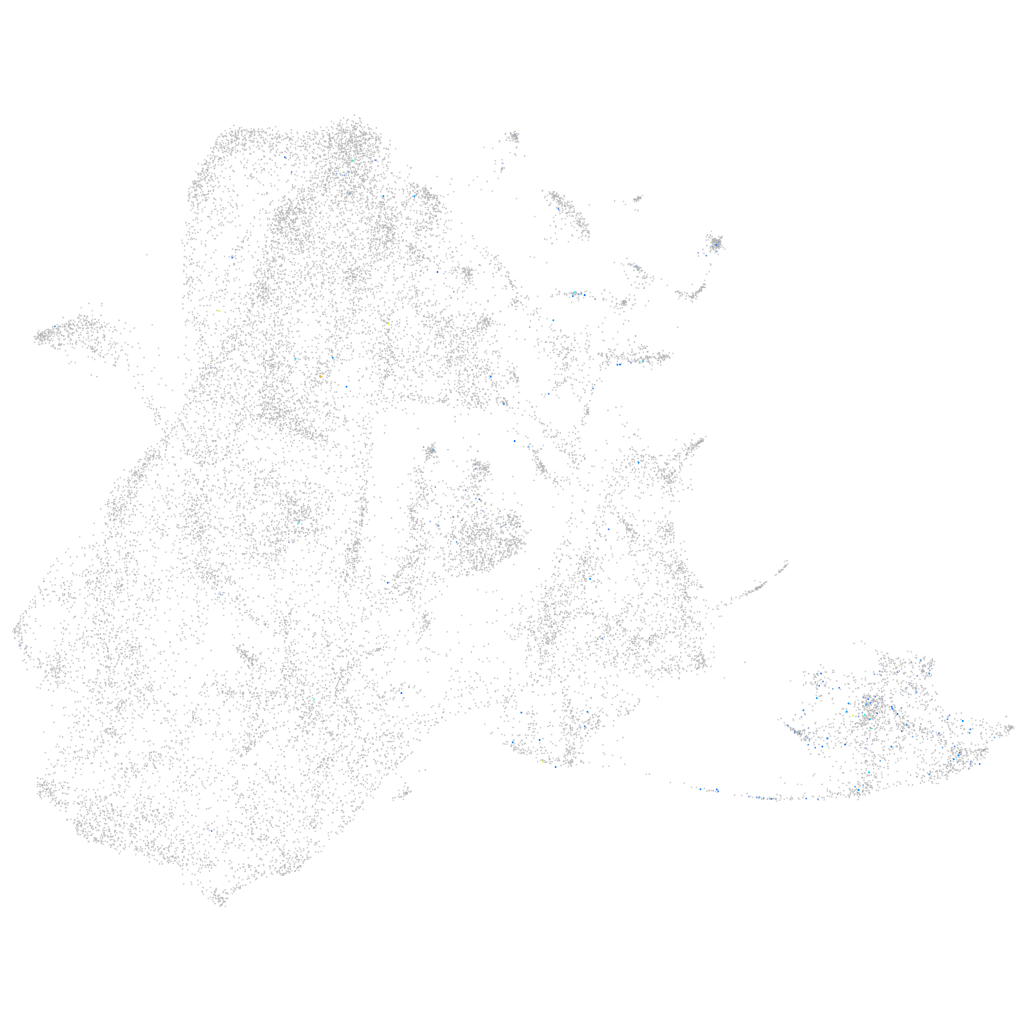
Gene expression UMAP
Display:
Expression
Stage
Other cell groups
all cells
blastomeres
PGCs
endoderm
axial mesoderm
muscle
mural cells /
non-skeletal muscle
mesenchyme
hematopoietic /
vasculature
pronephros
neural
spinal cord / glia
eye
taste / olfactory
otic / lateral line
epidermis
periderm
fin
ionocytes / mucous
pigment cells
Expression by stage/cluster
Correlated gene expression
Positive correlation
Negative correlation
Gene
r
Gene
r
lgals9l4
0.249
tmsb4x
-0.081
LOC101884649
0.220
cldni
-0.073
ca7
0.187
pfn1
-0.068
slco4a1
0.185
cldn1
-0.067
si:ch211-282j17.2
0.182
sparc
-0.061
zmp:0000000545
0.177
actb1
-0.059
grid2ipa
0.168
pak2a
-0.056
ptprjb.1
0.161
padi2
-0.055
CR354549.6
0.152
cd151l
-0.053
BX571884.1
0.148
spaca4l
-0.052
or137-2
0.147
tp63
-0.052
si:ch211-198m17.1
0.137
si:ch211-222l21.1
-0.051
CR396595.1
0.130
actb2
-0.050
si:dkey-87o1.2
0.130
pxna
-0.050
LOC110437779
0.129
ecrg4b
-0.050
LOC103910690
0.129
vdac3
-0.050
cldne
0.125
wls
-0.049
si:dkeyp-93a5.2
0.125
arpc4
-0.049
zgc:153665
0.123
col11a1a
-0.048
si:ch211-195b11.3
0.122
mdka
-0.048
cldn23a
0.122
ywhaz
-0.048
zgc:158263
0.120
cotl1
-0.048
zgc:174935
0.119
ccng1
-0.048
si:ch73-347e22.8
0.118
myh9a
-0.048
zgc:110333
0.118
her6
-0.048
ponzr5
0.118
tagln2
-0.047
zgc:158258
0.117
ptmaa
-0.047
selenow2b
0.116
flna
-0.047
gbgt1l4
0.116
col1a2
-0.047
si:ch73-204p21.2
0.116
si:dkey-16p21.8
-0.046
si:ch211-157c3.4
0.116
cyt1l
-0.046
evplb
0.116
col2a1b
-0.045
mgll
0.115
fkbp9
-0.045
XLOC-027129
0.114
ppib
-0.045
agr1
0.114
col18a1a
-0.044