Daniocell
trim2a (axial mesoderm)
tripartite motif containing 2a
ZFIN
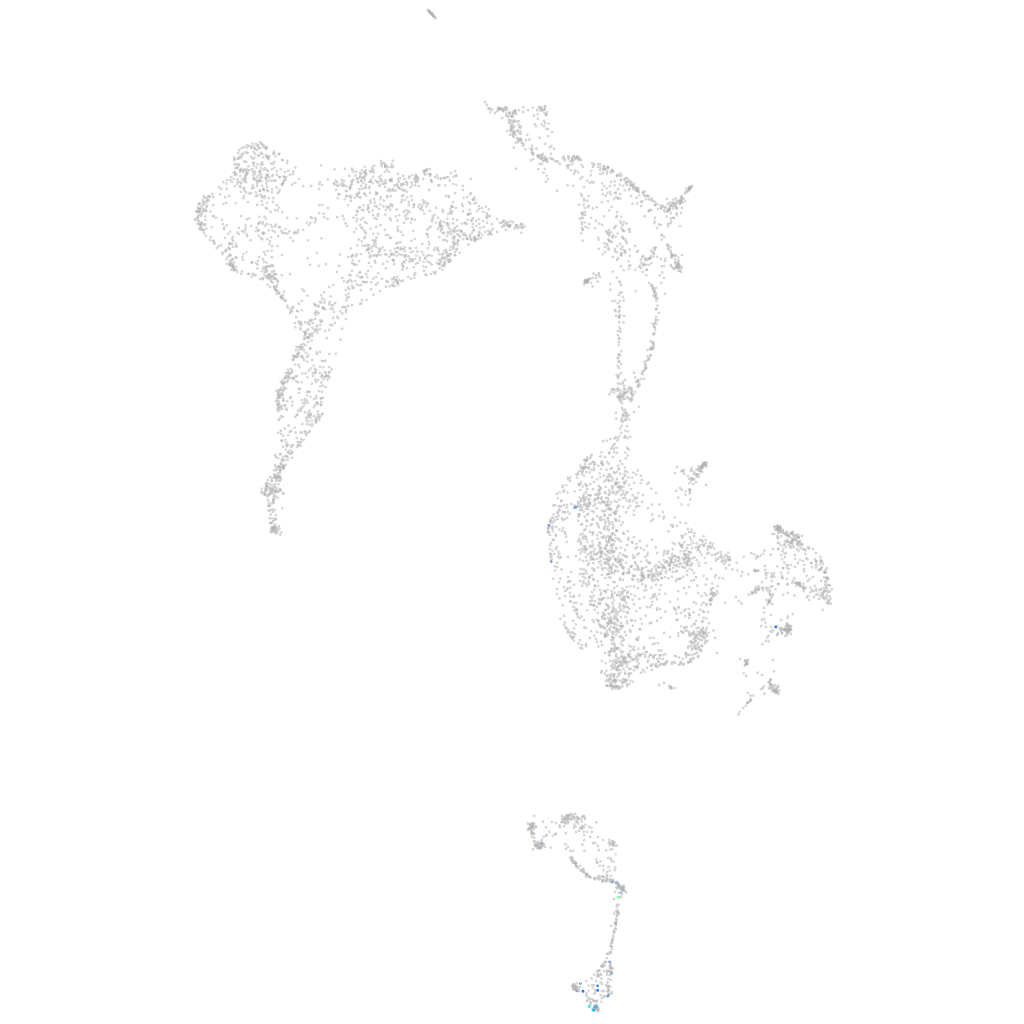
Gene expression UMAP
Display:
Expression
Stage
Other cell groups
all cells
blastomeres
PGCs
endoderm
axial mesoderm
muscle
mural cells /
non-skeletal muscle
mesenchyme
hematopoietic /
vasculature
pronephros
neural
spinal cord / glia
eye
taste / olfactory
otic / lateral line
epidermis
periderm
fin
ionocytes / mucous
pigment cells
Expression by stage/cluster
Correlated gene expression
Positive correlation
Negative correlation
Gene
r
Gene
r
XLOC-028023
0.525
ptmab
-0.107
mttp
0.471
qkia
-0.069
CT027832.1
0.451
h2afvb
-0.066
XLOC-028716
0.447
si:ch73-281n10.2
-0.063
LOC110439422.1
0.420
cx43.4
-0.062
snx20
0.344
tbxta
-0.061
zgc:110171
0.323
hspa8
-0.059
LOC103908705
0.323
ran
-0.057
si:dkey-112g5.12.1
0.323
khdrbs1a
-0.057
BX005174.1
0.323
hmga1a
-0.056
AL954134.1
0.308
hnrnpa0b
-0.055
BX005421.1
0.305
msna
-0.055
CR931782.2
0.285
hnrnpaba
-0.054
nrl
0.263
id1
-0.054
CABZ01039859.1
0.263
hmgb2b
-0.053
BX510922.2
0.263
eef1a1l1
-0.053
wisp1a
0.263
nucks1a
-0.052
LOC108179621
0.253
srsf3b
-0.052
crfb16
0.251
eif4a1a
-0.051
CABZ01040054.1
0.249
snrpd2
-0.051
LOC110439414
0.245
slc25a5
-0.051
leng9
0.243
snu13b
-0.051
si:ch211-218o21.4
0.242
setb
-0.051
marveld2b
0.239
nop10
-0.051
wbp2
0.239
snrpf
-0.051
PRRG3
0.235
si:ch211-288g17.3
-0.051
UNC13B
0.230
sap18
-0.051
zgc:174935
0.226
npm1a
-0.050
sowahab
0.225
tmed2
-0.050
elf3
0.220
tma7
-0.050
LOC103910448
0.220
kdelr2a
-0.050
cebpa
0.217
hsp90ab1
-0.049
ponzr5
0.215
syncrip
-0.048
slc15a1b
0.214
ncl
-0.048
eva1c
0.213
snrpe
-0.048