Daniocell
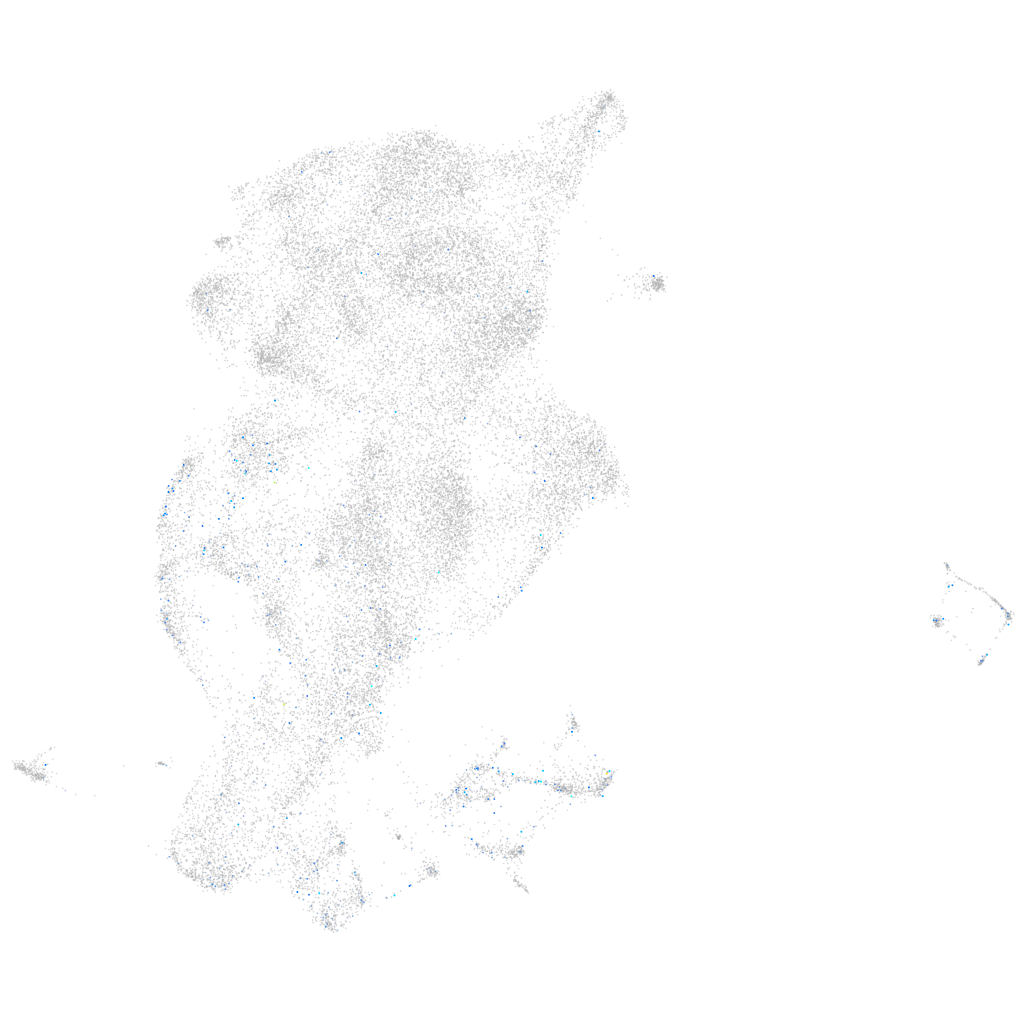
tmem132e (periderm)
transmembrane protein 132E
ZFIN
Gene expression UMAP
Display:
Expression
Stage
Other cell groups
all cells
blastomeres
PGCs
endoderm
axial mesoderm
muscle
mural cells /
non-skeletal muscle
mesenchyme
hematopoietic /
vasculature
pronephros
neural
spinal cord / glia
eye
taste / olfactory
otic / lateral line
epidermis
periderm
fin
ionocytes / mucous
pigment cells
Expression by stage/cluster
Correlated gene expression
Positive correlation
Negative correlation
Gene
r
Gene
r
LOC103910741
0.124
krtt1c19e
-0.067
si:ch73-233f7.5
0.118
cyt1
-0.065
CABZ01117780.1
0.114
wu:fa03e10
-0.065
LOC110438226
0.111
si:ch211-207n23.2
-0.062
si:ch73-379f5.5
0.111
krt17
-0.056
si:dkeyp-93a5.3
0.111
si:dkeyp-51b9.3
-0.054
LOC100538255
0.110
eevs
-0.050
BX511023.1
0.109
krt4
-0.049
CU929145.1
0.107
rplp2
-0.047
zgc:162160
0.106
si:ch211-195b11.3
-0.047
XLOC-012822
0.104
si:dkey-16p21.8
-0.047
CU467043.1
0.104
si:dkey-33c14.3
-0.046
rxfp3.2a
0.102
selenow2b
-0.043
zgc:193593
0.101
tdh
-0.043
si:ch73-54n14.2
0.100
ahcy
-0.043
crp1
0.100
romo1
-0.042
CR848791.1
0.096
rpl37
-0.041
LO018107.1
0.095
icn2
-0.041
BX088603.1
0.095
XLOC-011066
-0.041
si:ch211-245j22.3
0.093
rplp1
-0.041
LOC103910192
0.090
ddx21
-0.040
XLOC-012207
0.090
mapre1a
-0.040
il2rb
0.089
pycard
-0.039
CU657925.1
0.086
si:ch211-105c13.3
-0.039
FP016012.1
0.086
scel
-0.039
LOC101884122
0.086
s100v2
-0.039
zgc:110699
0.085
tlcd1
-0.038
si:ch73-106l15.4
0.085
selenow1
-0.038
crb1
0.085
si:dkey-247k7.2
-0.037
si:ch211-220f21.3
0.085
eef1da
-0.037
LOC100537369
0.084
rhbg
-0.037
zgc:165461
0.083
CABZ01051602.1
-0.037
marcksl1b
0.083
abcb5
-0.036
LOC108182317
0.083
eif4ebp3
-0.036
macf1b
0.083
si:dkey-7c18.24
-0.035