Daniocell
tmem132e (blastomeres)
transmembrane protein 132E
ZFIN
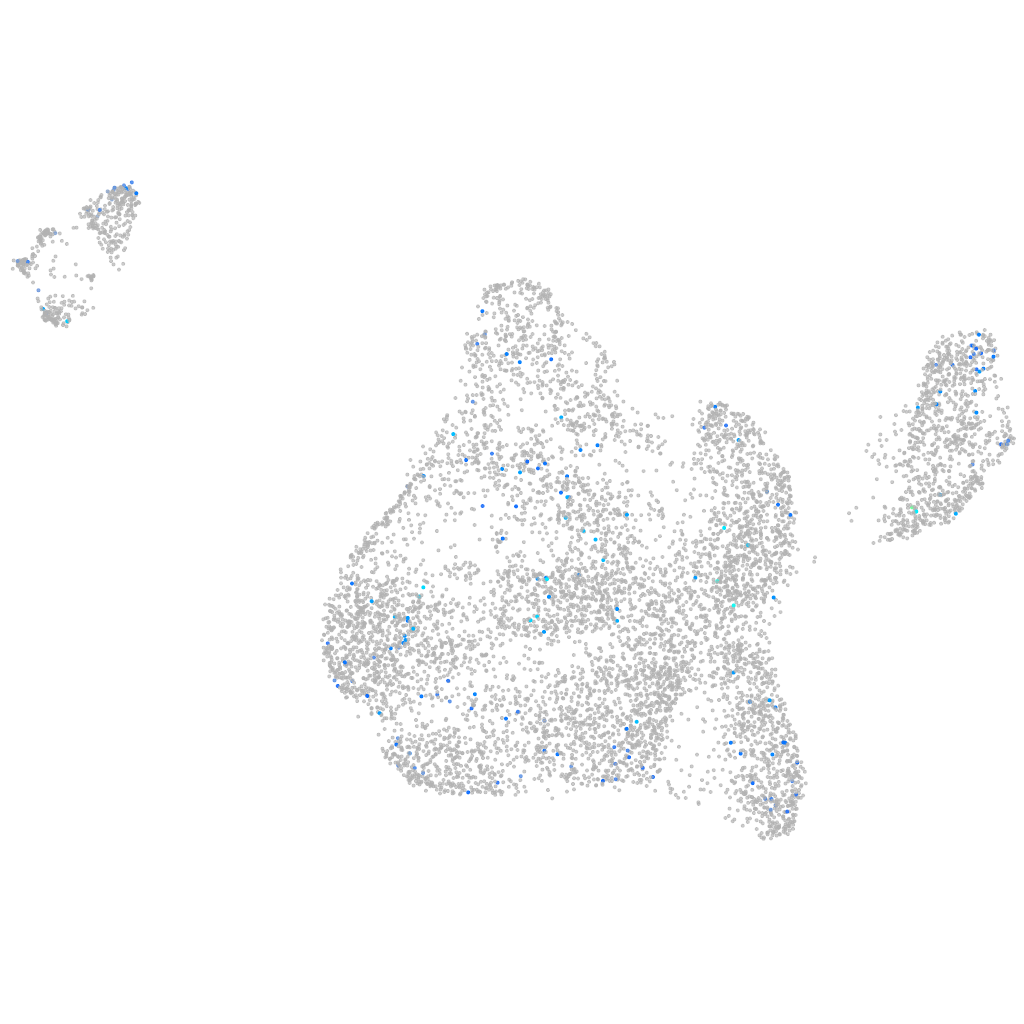
Gene expression UMAP
Display:
Expression
Stage
Other cell groups
all cells
blastomeres
PGCs
endoderm
axial mesoderm
muscle
mural cells /
non-skeletal muscle
mesenchyme
hematopoietic /
vasculature
pronephros
neural
spinal cord / glia
eye
taste / olfactory
otic / lateral line
epidermis
periderm
fin
ionocytes / mucous
pigment cells
Expression by stage/cluster
Correlated gene expression
Positive correlation
Negative correlation
Gene
r
Gene
r
si:dkey-19a16.12
0.127
NC-002333.4
-0.038
BX088712.1
0.124
serpinh1b
-0.030
LOC110438614
0.123
gmfb
-0.030
CT573279.1
0.121
CABZ01080568.1
-0.027
LOC110439573
0.111
hsp90aa1.2
-0.026
htr1ab
0.110
gsr
-0.026
LOC108181115
0.110
ehd1b
-0.025
tmem150c
0.108
bzw2
-0.025
abcb4
0.103
ing5b
-0.024
CT030005.2
0.101
rplp2l
-0.024
CABZ01099795.1
0.101
gnl3
-0.024
LOC101886835
0.100
si:dkey-30k6.5
-0.024
LO018333.1
0.099
ptp4a2b
-0.024
sall1b
0.098
si:ch211-235e9.6
-0.024
trim69
0.097
miga1
-0.023
or105-1
0.097
ezh2
-0.023
si:ch211-227e10.2
0.096
COLGALT1
-0.023
si:ch73-144l3.1
0.095
si:dkey-21c1.8
-0.023
slc35g2b
0.094
CABZ01074453.1
-0.023
si:dkey-7e14.3
0.092
ddit3
-0.022
dkk1a
0.090
atp5pb
-0.022
trpc1
0.087
rps15a
-0.022
pdlim3a
0.085
BX537342.1
-0.022
BX323575.1
0.085
arl2bp
-0.022
foxf1
0.084
xk
-0.022
LOC103911458
0.084
si:ch73-221f6.4
-0.022
LOC103909855
0.084
zgc:173575
-0.022
si:ch211-186j3.6
0.082
gadd45ga
-0.021
taar20i
0.082
bckdhbl
-0.021
si:ch211-274f20.2
0.081
zgc:153738
-0.021
nitr11a
0.081
AL590151.1
-0.021
CABZ01071939.1
0.080
gtf2h4
-0.021
CABZ01072532.1
0.079
surf6
-0.021
CR931802.2
0.079
birc2
-0.021
CR847543.2
0.078
thap3
-0.021