Daniocell
tmem101 (otic / lateral line)
transmembrane protein 101
ZFIN
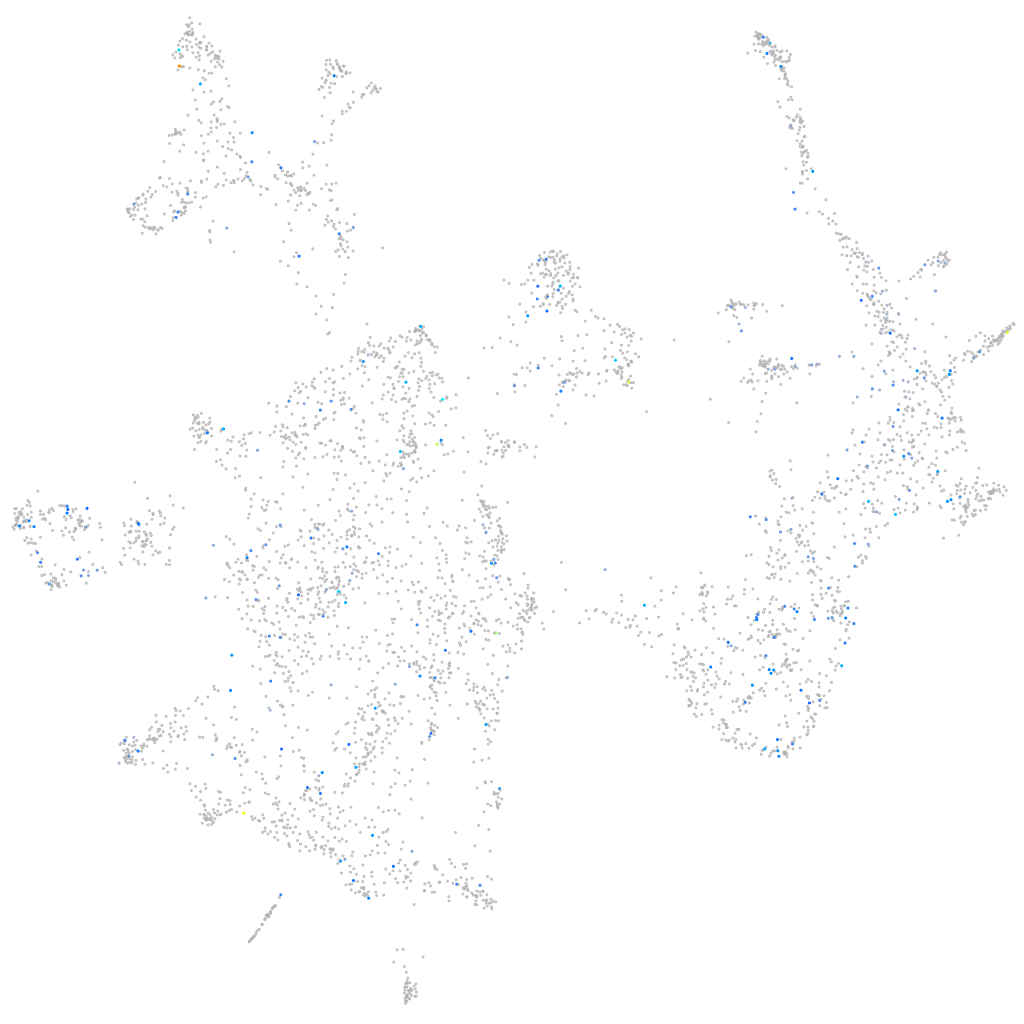
Gene expression UMAP
Display:
Expression
Stage
Other cell groups
all cells
blastomeres
PGCs
endoderm
axial mesoderm
muscle
mural cells /
non-skeletal muscle
mesenchyme
hematopoietic /
vasculature
pronephros
neural
spinal cord / glia
eye
taste / olfactory
otic / lateral line
epidermis
periderm
fin
ionocytes / mucous
pigment cells
Expression by stage/cluster
Correlated gene expression
Positive correlation
Negative correlation
Gene
r
Gene
r
nrn1b
0.178
med30
-0.048
LOC101883343
0.176
prss59.2
-0.047
si:dkey-246j6.1
0.165
CELA1 (1 of many)
-0.042
LOC108183612
0.164
wfdc2
-0.040
zmp:0000001082
0.160
apoa2
-0.040
LOC100330797
0.155
tgfb3
-0.039
BX470229.1
0.153
znf395b
-0.039
gaa3-as
0.152
prss1
-0.039
LOC101882645
0.150
col2a1b
-0.038
LOC101885149
0.133
eps8l1a
-0.037
acd
0.125
ucmab
-0.036
olfcw1
0.124
igf2b
-0.035
LOC100329307
0.123
hbl1
-0.035
guca1d
0.121
tgfbr3
-0.034
LOC110438512
0.120
prss59.1
-0.034
si:ch211-214b16.4
0.113
gngt2b
-0.034
CU467822.2
0.112
nupr1a
-0.034
si:dkey-40n15.1
0.111
cdkn1a
-0.033
gls2b
0.111
zgc:113531
-0.033
BX119926.1
0.105
mgrn1a
-0.033
FP102192.2
0.105
cnmd
-0.033
col10a1b
0.102
atp1a1a.4
-0.033
CR384099.1
0.102
gabarapl2
-0.033
mir375-2
0.102
CR384075.1
-0.033
si:ch211-117i20.2
0.101
col2a1a
-0.033
rbsn
0.100
sfrp5
-0.033
or123-1
0.100
alkbh3
-0.032
LOC103912024
0.099
apoa1b
-0.032
LOC103910107
0.097
wbp2nl
-0.032
CABZ01073736.1
0.096
anxa13
-0.032
asah2
0.096
ptpn5
-0.032
nlrp15
0.096
ttn.1
-0.031
hnf4g
0.095
rfxap
-0.031
anxa6
0.095
socs3a
-0.031
si:ch73-181m17.1
0.094
ctnnd2a
-0.031