Daniocell
tmem101 (glial cells / spinal cord)
transmembrane protein 101
ZFIN
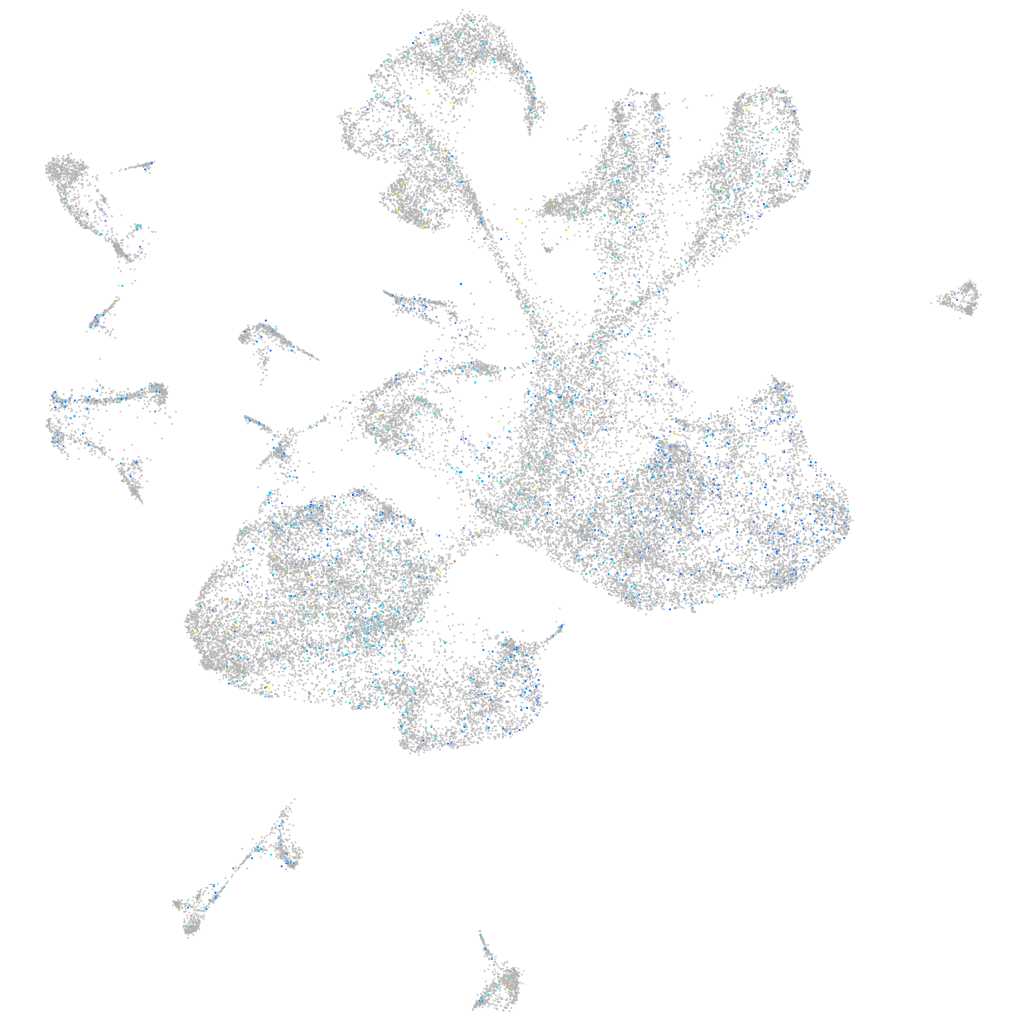
Gene expression UMAP
Display:
Expression
Stage
Other cell groups
all cells
blastomeres
PGCs
endoderm
axial mesoderm
muscle
mural cells /
non-skeletal muscle
mesenchyme
hematopoietic /
vasculature
pronephros
neural
spinal cord / glia
eye
taste / olfactory
otic / lateral line
epidermis
periderm
fin
ionocytes / mucous
pigment cells
Expression by stage/cluster
Correlated gene expression
Positive correlation
Negative correlation
Gene
r
Gene
r
XLOC-043000
0.075
ppdpfb
-0.022
nmbb
0.057
tmie
-0.021
AL844563.1
0.053
atcaya
-0.021
XLOC-024826
0.052
scrt2
-0.019
gpc6b
0.051
onecut1
-0.019
apobec2b
0.049
fndc4b
-0.019
st3gal1l2
0.048
snap25a
-0.018
MPP4 (1 of many)
0.047
nhlh2
-0.018
LOC103910388
0.045
stxbp1a
-0.018
CU467042.1
0.043
gsx1
-0.018
tmem182b
0.042
map1lc3a
-0.017
CU571091.1
0.042
apoa2
-0.017
si:ch211-208f21.3
0.042
sncb
-0.017
si:dkey-152b24.6
0.042
shdb
-0.017
XLOC-042711
0.040
lin28a
-0.017
nos2a
0.039
histh1l
-0.016
slc16a7
0.039
calm1a
-0.016
CR382296.1
0.039
vdac3
-0.016
XLOC-026153
0.039
slc26a11
-0.016
AL807792.1
0.038
shisa7b
-0.016
BX276101.1
0.038
fthl27
-0.016
slc35e2b
0.038
ankra2
-0.015
lmod3
0.037
BX569787.1
-0.015
LOC108184018
0.037
bnip3lb
-0.015
XLOC-024493
0.037
basp1
-0.015
tram1
0.037
stmn1b
-0.015
CR759875.1
0.036
apoa1b
-0.015
si:zfos-2372e4.1
0.036
plch2a
-0.015
zgc:171500
0.036
gch2
-0.015
si:ch211-233h19.2
0.035
fabp1b.1
-0.015
bdkrb2
0.035
klhl8
-0.015
CU207281.2
0.035
nppc
-0.015
xbp1
0.035
stap2a
-0.015
slc39a7
0.034
nanos1
-0.015
hsp90b1
0.034
dusp22a
-0.015