Daniocell
tmco4 (periderm)
transmembrane and coiled-coil domains 4
ZFIN
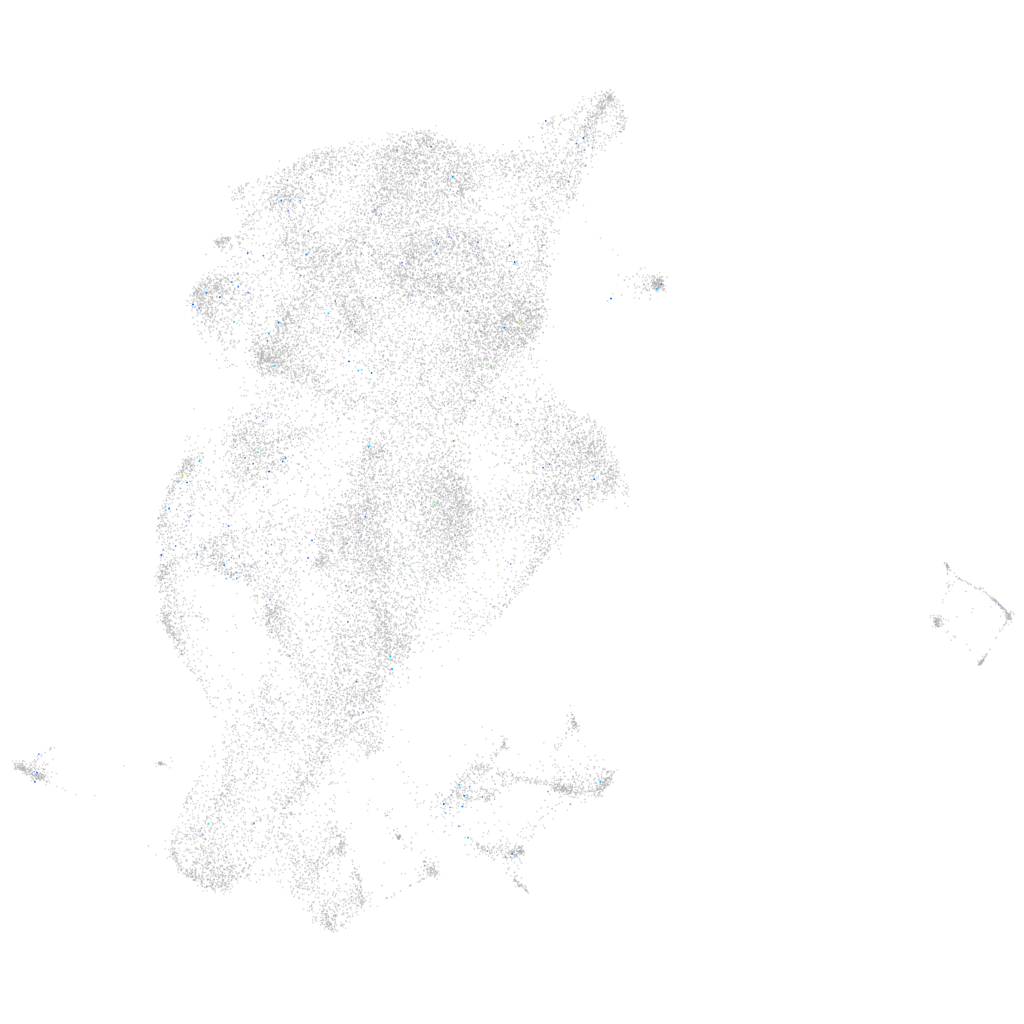
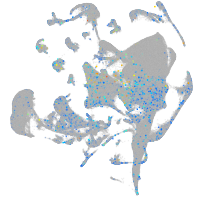
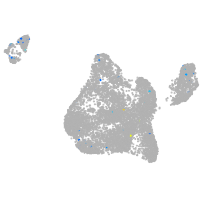
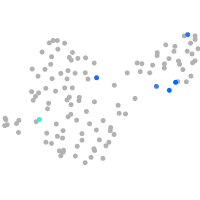
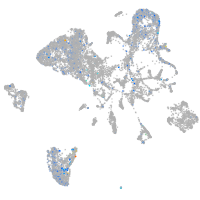
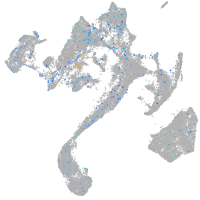
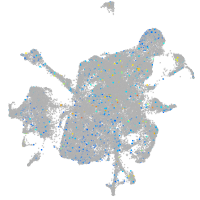
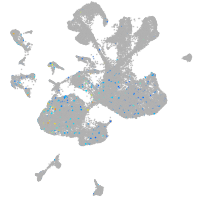
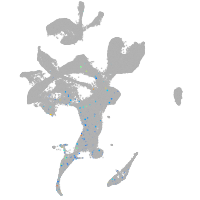
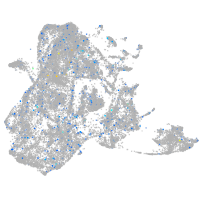
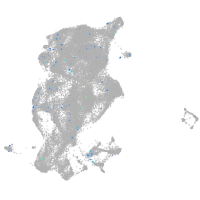
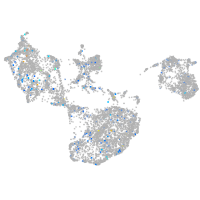
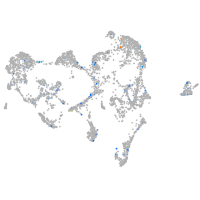
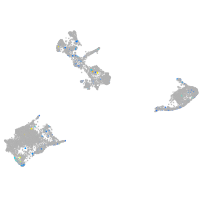
Gene expression UMAP
Display:
Expression
Stage
Other cell groups
all cells
blastomeres
PGCs
endoderm
axial mesoderm
muscle
mural cells /
non-skeletal muscle
mesenchyme
hematopoietic /
vasculature
pronephros
neural
spinal cord / glia
eye
taste / olfactory
otic / lateral line
epidermis
periderm
fin
ionocytes / mucous
pigment cells
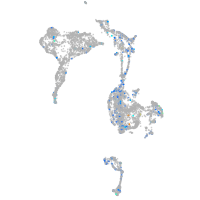
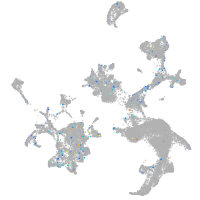
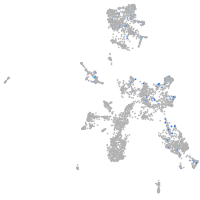
Expression by stage/cluster
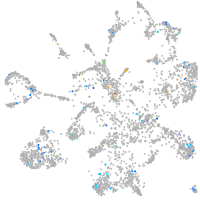
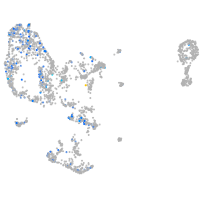
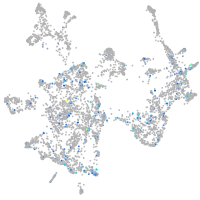
Correlated gene expression
Positive correlation
Negative correlation
Gene
r
Gene
r
tmem184bb
0.147
krt4
-0.020
BX255944.1
0.131
s100a10b
-0.020
XLOC-042915
0.118
gsta.1
-0.018
LOC101884473
0.104
cyt1
-0.017
BX601648.1
0.093
CU693379.1
-0.016
kcnk15
0.092
zgc:193505
-0.016
XLOC-018000
0.089
elovl1a
-0.015
si:ch211-197e7.3
0.087
capn9
-0.015
ttc12
0.086
acy3.2
-0.015
CABZ01066921.1
0.083
cxcl14
-0.015
si:dkeyp-85d8.5
0.083
cyt1l
-0.014
cldnj
0.082
si:dkey-16p21.8
-0.014
FP245526.1
0.081
s100w
-0.014
CU062632.1
0.080
XLOC-019059
-0.014
zgc:171604
0.077
si:ch211-166a6.5
-0.014
XLOC-030409
0.075
si:cabz01007794.1
-0.014
tmem72
0.073
msx2a
-0.014
btr18.1
0.073
mboat1
-0.014
fam155b
0.072
zgc:136892
-0.014
znf1027
0.069
krt8
-0.014
si:dkey-23a13.9
0.069
ppl
-0.014
pea15
0.068
nccrp1
-0.013
BX649529.1
0.067
AL929237.1
-0.013
si:dkey-7j22.4
0.065
krt92
-0.013
LOC110438002
0.064
cst14b.1
-0.013
LOC561361
0.064
si:ch211-147d7.5
-0.013
LOC101886920
0.064
evplb
-0.013
si:dkey-282h22.5
0.064
icn
-0.013
si:dkeyp-80d11.4
0.063
bcat2
-0.013
mkxa
0.061
s100v1
-0.013
ppp2caa
0.060
dnah11
-0.013
sema5a
0.059
pnp5a
-0.013
LOC101882355
0.059
si:ch211-157c3.4
-0.013
tmem151a
0.058
uap1
-0.013
si:ch211-112f3.4
0.058
hoxc3a
-0.012