Daniocell
tcaim (axial mesoderm)
"T cell activation inhibitor, mitochondrial"
ZFIN
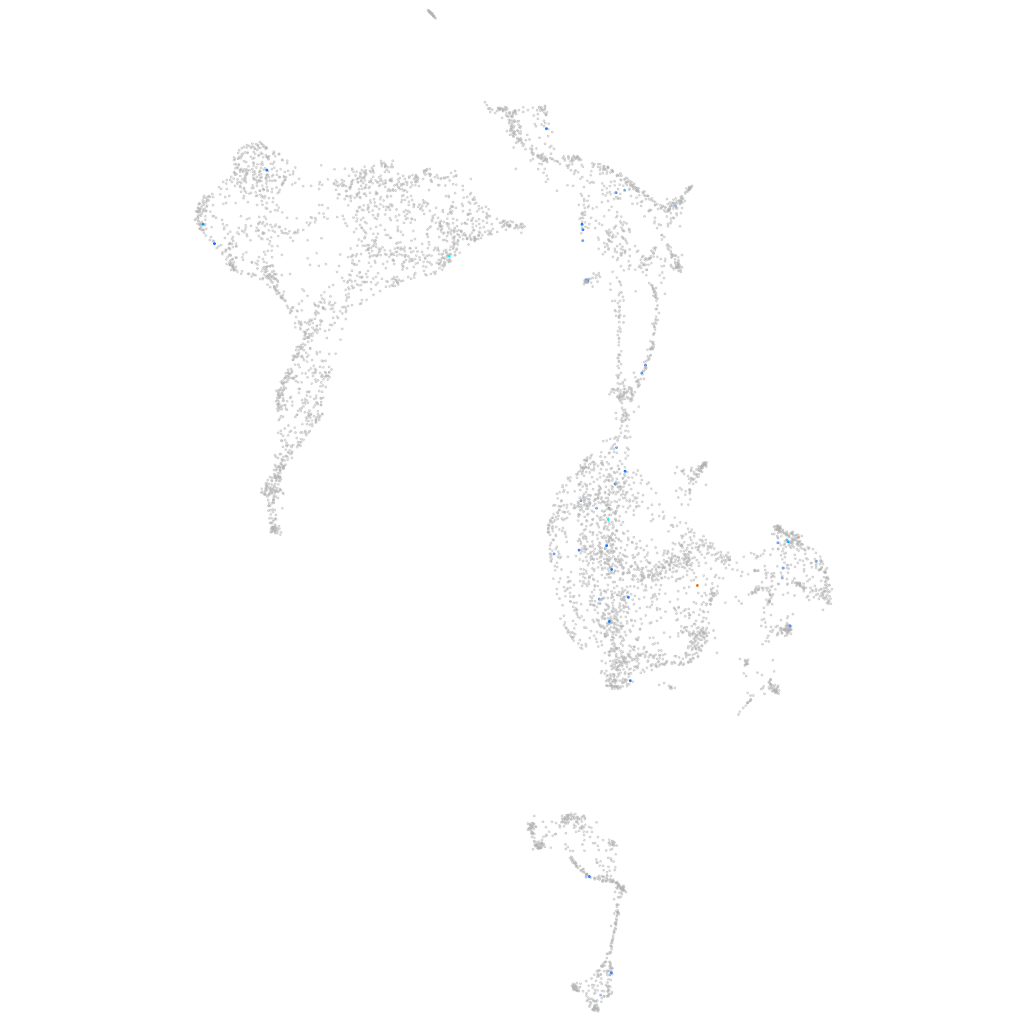
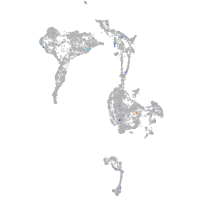
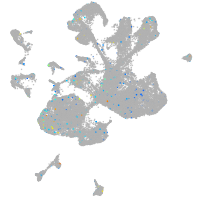
Gene expression UMAP
Display:
Expression
Stage
Other cell groups
all cells
blastomeres
PGCs
endoderm
axial mesoderm
muscle
mural cells /
non-skeletal muscle
mesenchyme
hematopoietic /
vasculature
pronephros
neural
spinal cord / glia
eye
taste / olfactory
otic / lateral line
epidermis
periderm
fin
ionocytes / mucous
pigment cells
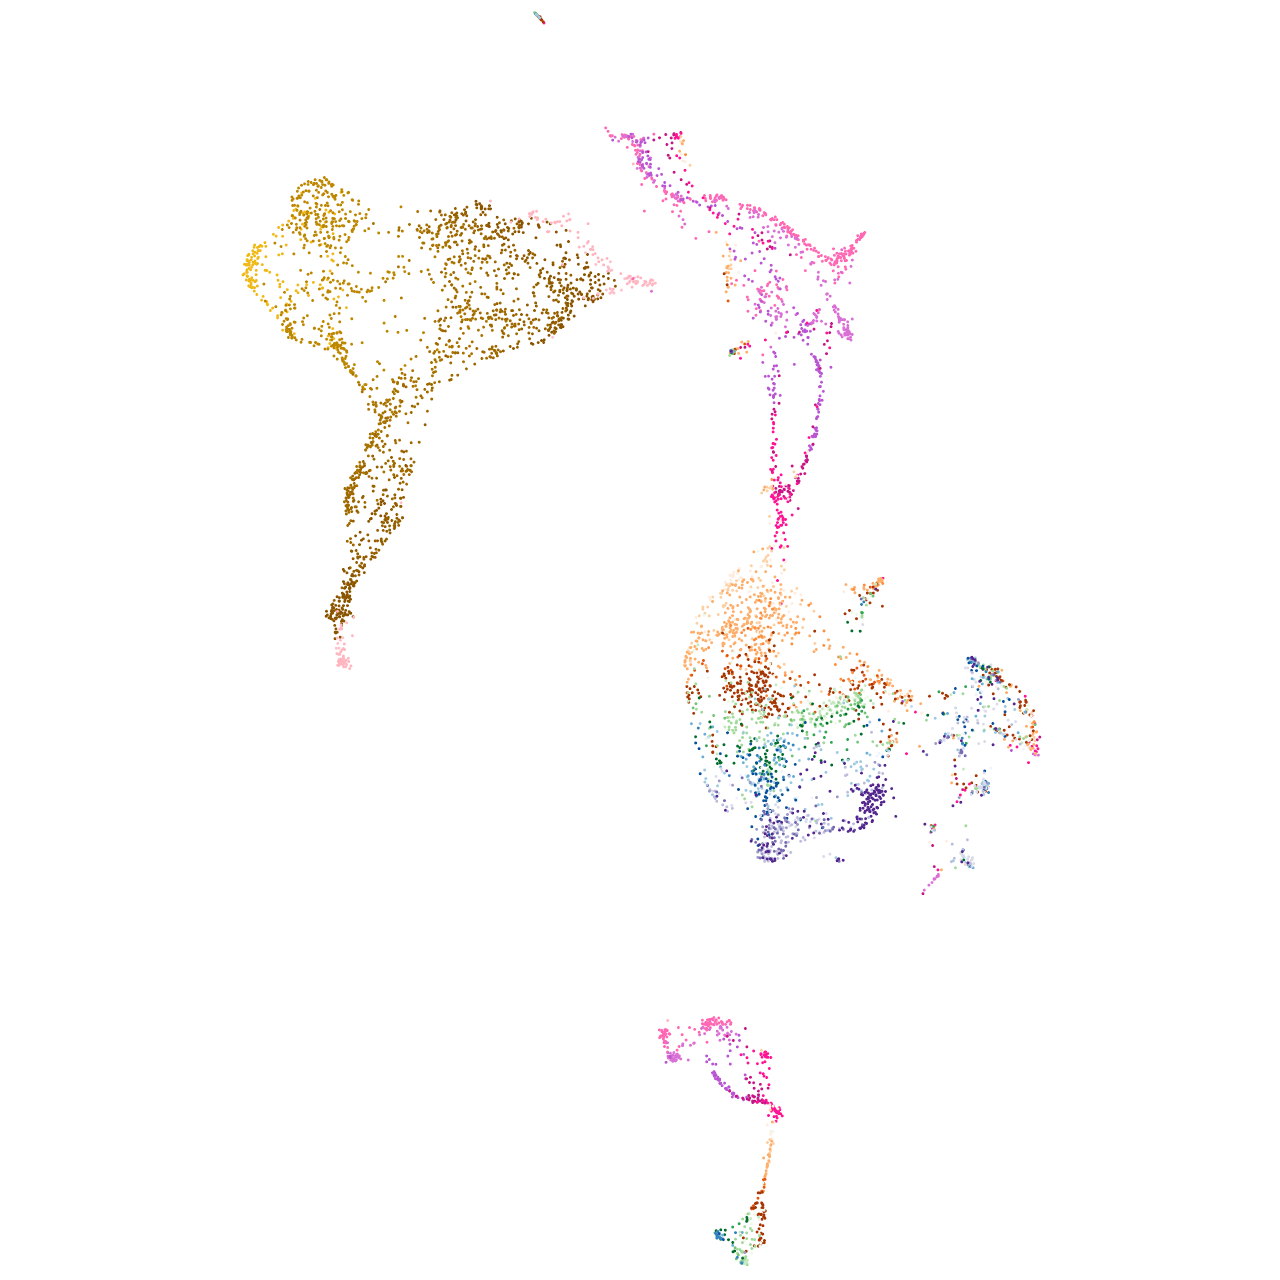
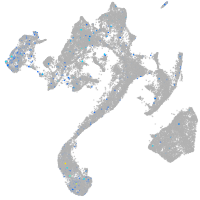
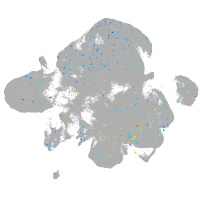
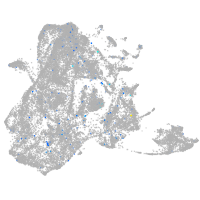
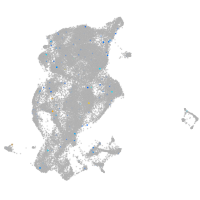
Expression by stage/cluster
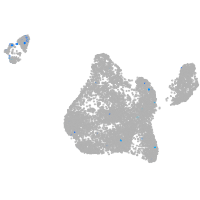
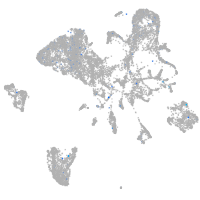
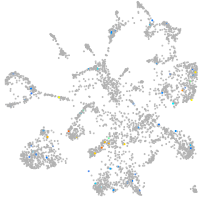
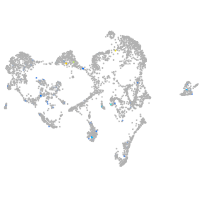
Correlated gene expression
Positive correlation
Negative correlation
Gene
r
Gene
r
CR847906.1
0.374
si:dkey-151g10.6
-0.059
si:dkeyp-92c9.2
0.348
ptmab
-0.044
XLOC-011941
0.337
hmga1a
-0.044
si:cabz01007802.1
0.281
h2afvb
-0.043
mapk8ip2
0.216
rrs1
-0.042
LOC100333482
0.216
npm1a
-0.042
si:dkey-52j6.3
0.202
hspb1
-0.040
trdc
0.188
zgc:91910
-0.040
AL840638.1
0.181
eif4bb
-0.040
adck5
0.180
hmgb2a
-0.039
si:dkey-175m17.7
0.172
mybbp1a
-0.039
rictorb
0.170
rpl29
-0.037
znf362a
0.161
ebna1bp2
-0.037
celf5a
0.159
rps12
-0.037
gad2
0.158
acin1b
-0.037
CU856539.2
0.155
dkc1
-0.037
CR954285.1
0.152
tma7
-0.037
asb15b
0.150
snrpb
-0.037
LOC110438396
0.150
si:ch73-1a9.3
-0.036
tfap2b
0.149
phf5a
-0.036
XLOC-026855
0.146
nop58
-0.036
si:ch1073-429i10.3
0.146
hnrnpub
-0.036
LOC103911173
0.146
si:ch211-222l21.1
-0.036
LOC101882470
0.143
ncl
-0.036
si:dkey-183c2.4
0.143
etf1b
-0.036
LOC103909406
0.140
snrpf
-0.036
camk2d2
0.139
ran
-0.036
si:ch73-359m17.7
0.136
anp32e
-0.035
LOC110438548
0.136
ube2c
-0.035
FRMD1
0.136
sfpq
-0.035
cd302
0.136
hmgb2b
-0.034
tfap2c
0.134
rbm8a
-0.034
rusc2
0.133
g3bp1
-0.034
cd44b
0.132
cirbpb
-0.034
LOC103909945
0.130
si:ch73-281n10.2
-0.034